Supply and Demand Zones: How to Trade Them on TradingView
Where big orders left their footprint — and price returns to fill them. Learn to spot fresh zones, read the imbalance, and trade the return.
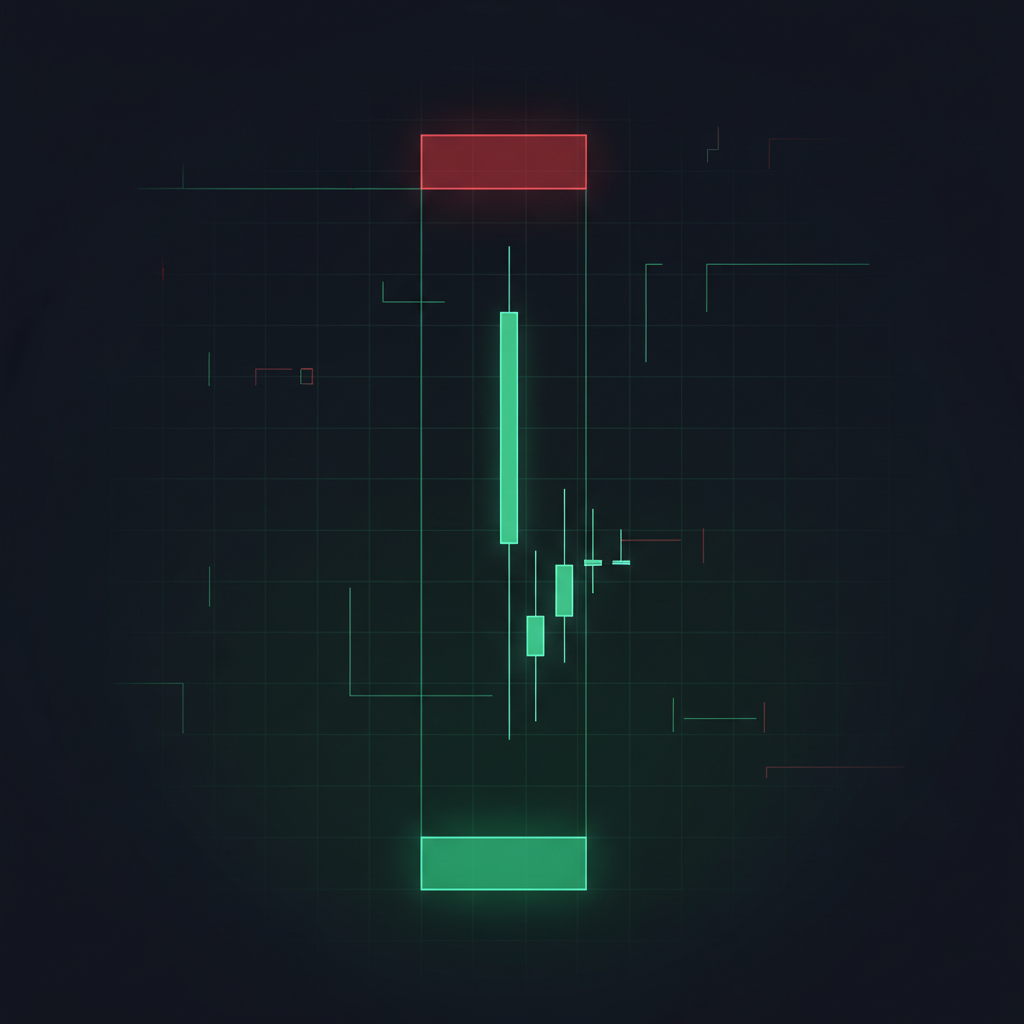
A demand zone is a price area where strong buying once overwhelmed selling and launched price upward — so when price returns, buyers tend to show up again. A supply zone is the mirror: an area where heavy selling crushed price down. You trade them by marking the zone where the big move began, then waiting for price to return and react. Fresh, untested zones are the strongest.
Support and resistance asks "where does price stop?" Supply and demand asks a sharper question: "where did a big imbalance of orders launch a move — and is there unfilled business left there?" It's the retail-friendly cousin of institutional order-flow trading, and once you see it, you can't unsee it.
Demand vs supply: the twin concept
⬆️ Demand Zone
The base where price paused, then exploded up. Buyers were so aggressive they left orders unfilled. When price returns to that base, buyers often reappear there. A floor with a memory.
⬇️ Supply Zone
The base where price paused, then collapsed down. Sellers overwhelmed buyers and left orders unfilled. When price climbs back, sellers often reappear there. A ceiling with a memory.
Why zones work: the unfilled-order story
When an institution wants to buy a massive position, it can't do it all at once without spiking the price against itself. The common explanation is that it accumulates in an area, price launches before the position is complete, and unfilled orders are left behind — the demand zone. Whether or not that is literally what happens, price often reacts when it drifts back to that area, which is what makes the zone worth marking. The "footprint" of that original move is what you're marking on the chart.
How to trade a zone, step by step
1. Find the explosive move
Look for a sharp, decisive move away from a small consolidation. The strength of the departure tells you how serious the imbalance was. Lazy, grinding moves make weak zones; violent ones make strong zones.
2. Prefer fresh zones
A zone that price hasn't returned to yet is "fresh" — the unfilled orders are still sitting there. Each time price revisits and the zone holds, some of that fuel gets used up. By the third test, the zone is usually exhausted.
3. Wait for the return & react
Mark the zone and be patient. When price returns, look for a reaction inside it — a rejection candle, a momentum stall. Enter on confirmation, place your stop just beyond the far edge of the zone, and target the next opposing zone.
🔗 Supply/demand vs. order blocks — what's the difference?
They're close relatives. "Supply and demand" is the retail framing; "order blocks" is the Smart Money Concepts (SMC) framing of the same idea — the last opposing candle before an imbalance move. If you want the institutional version, read our guide to Order Blocks and the full Smart Money Concepts breakdown.
The hard part: marking zones objectively, at scale
Drawing a clean zone on one chart you're staring at is straightforward. The problem is doing it consistently, across dozens of assets, while also tracking which zones are fresh, which are tested, and which have been invalidated. That's hours of manual work — and the moment you blink, a fresh zone gets tested without you.
🐐 Smart Money Concepts, built into the Score
The G.O.A.T. Toolkit on Algoat.TV detects Smart Money structure — Order Blocks, Fair Value Gaps, Break of Structure and Change of Character — automatically, and feeds them into the math rather than just drawing boxes you have to interpret. It's part of the 250+ technical-analysis evidence points the suite reads on every bar across 8 scoring engines, all rolled into one 0–100 Score.
So the imbalance read isn't a separate manual chore — it's already weighed into the number you're looking at. You still call the shot; the zone-hunting just stops being your job.
A simple supply & demand workflow
Start on the higher timeframe
Mark the major zones on the daily or 4H first. Higher-timeframe zones carry more weight and get respected more.
Mark the base before the launch
Find the tight consolidation right before a strong impulse move. Box it. That base is your zone.
Flag it fresh or tested
Has price returned yet? Fresh zones are your A-setups. Note how many times each has been tested.
Wait for the return
Set an alert at the zone. When price arrives, look for a reaction — don't pre-empt it.
Confirm, then decide
Zone reaction plus trend and momentum agreeing = confluence. If they conflict, pass. You make the call.
4 common supply & demand mistakes
Drawing zones around weak moves. No strong impulse = no real imbalance = no zone. Demand an explosive departure.
Trading exhausted zones. By the third tap, the unfilled orders are mostly gone. Fresh zones are where the edge lives.
Making zones too wide. A giant zone "works" only because it's huge. Tight zones give better risk-to-reward.
Ignoring the trend. Demand zones in a downtrend fail often. Trade zones with the higher-timeframe direction.
Frequently asked questions
QWhat is a supply and demand zone in trading?
A demand zone is a price area where aggressive buying once launched a strong move up, leaving unfilled buy orders that defend the level when price returns. A supply zone is the opposite — an area where heavy selling crushed price down. Traders mark these zones and wait for price to return and react.
QWhat's the difference between supply/demand and support/resistance?
Support and resistance are usually single horizontal lines based on past highs and lows. Supply and demand are zones based on where a strong imbalance launched a move. S&D is more specific about why the level matters — the unfilled orders behind the move — while S/R is broader.
QAre supply/demand zones the same as order blocks?
They're nearly the same idea in different language. "Supply and demand" is the retail framing; "order block" is the Smart Money Concepts term for the last opposing candle before an imbalance move. The G.O.A.T. Toolkit detects order blocks automatically as part of its Smart Money Concepts engine.
QWhat makes a strong demand or supply zone?
Three things: a sharp, explosive move away from the base (strong imbalance); the zone being fresh and untested (orders still unfilled); and alignment with the higher-timeframe trend. Tight zones at higher timeframes that haven't been revisited are the strongest.
QIs there an indicator that finds supply and demand zones automatically?
Yes. Algoat.TV's G.O.A.T. Toolkit auto-detects Smart Money structure — order blocks, fair value gaps and more — and feeds it into its 0–100 Score, so the imbalance read is already factored in rather than left as a manual drawing exercise.
See the zones the math respects — automatically.
Smart Money structure, weighed into one 0-100 Score across your whole watchlist. Free for 7 days.
🚀 Start Your 7-Day Free TrialDisclaimer: This article is educational and not financial advice. Algoat.TV indicators are quantitative analysis tools — they do not provide trade signals, recommendations, or guaranteed outcomes. Trading involves risk of loss. Always do your own research and trade your own plan.