Golden Cross & Death Cross: The Moving Average Strategy Explained
Golden Cross & Death Cross
The most famous chart events in trading — splashed across financial headlines every time they happen. Here's what they actually mean, why they lag, and how to trade crossovers properly.
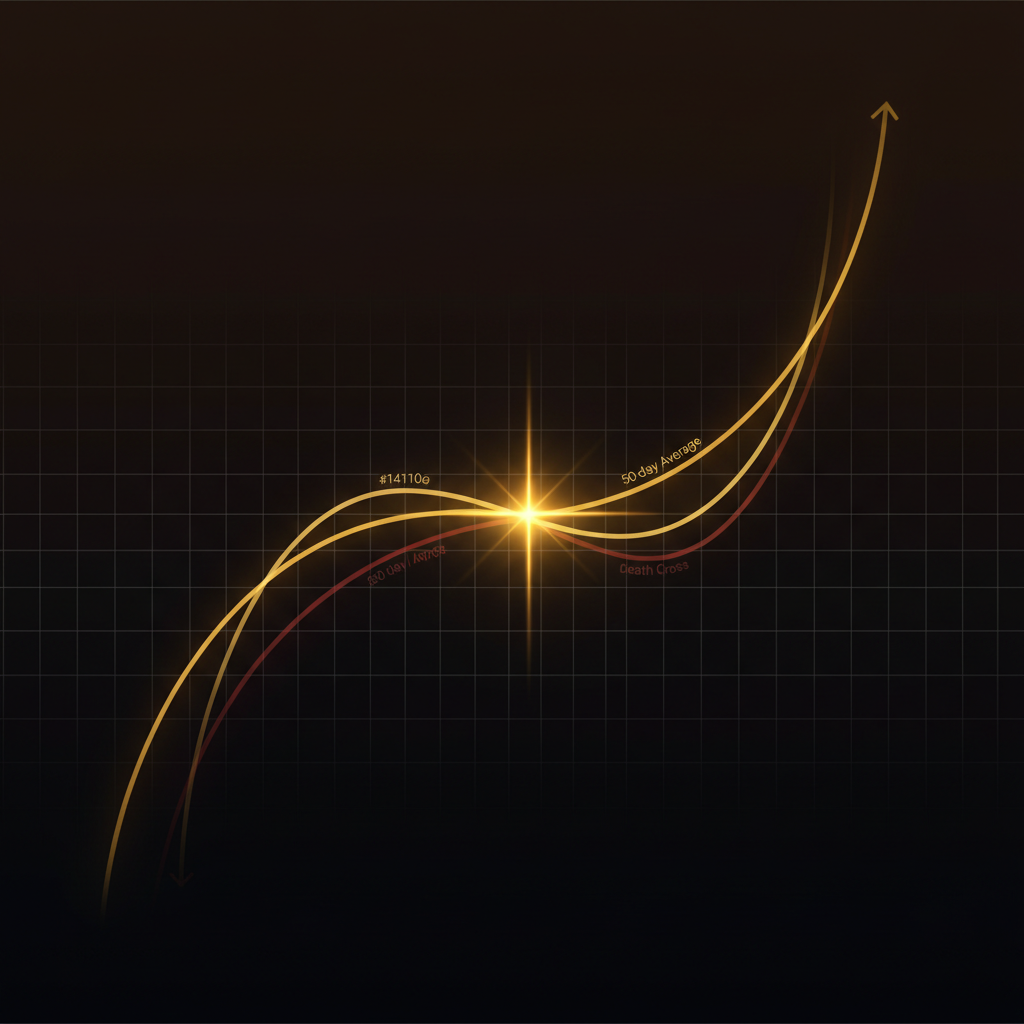
A golden cross happens when a shorter moving average (usually the 50-day) crosses above a longer one (usually the 200-day) — a classic bullish, long-term trend signal. A death cross is the opposite: the 50 crossing below the 200, signaling a bearish shift. They're powerful for confirming the big-picture trend — but they lag, so they confirm a move rather than predict it.
Few chart events get as much attention as the golden cross and death cross — mainstream finance media announce them like weather events. That popularity is exactly why they matter (so many eyes act on them) and exactly why they're misunderstood. This guide explains both, the moving-average crossover strategy behind them, and the one weakness you must respect.
The two crosses, side by side
🏆 Golden Cross
The 50-day MA crosses above the 200-day MA. Short-term momentum has overtaken the long-term trend — widely read as the start of a bullish, longer-term uptrend. The market's "all clear" headline.
💀 Death Cross
The 50-day MA crosses below the 200-day MA. Short-term momentum has broken under the long-term trend — widely read as the onset of a bearish, longer-term downtrend. The market's warning siren.
Why crossovers work — and why they lag
A moving average is just the average price over a set period, which smooths out the noise so the underlying trend is visible. A crossover of two MAs marks the moment the faster average's trend overtakes the slower one's — a genuine, objective shift in trend.
But here's the catch you must internalize: because moving averages are built from past prices, a crossover only happens after a move is well underway. The 50/200 golden cross is a fantastic confirmation of a major trend — and a terrible tool for catching the exact bottom. It confirms; it does not predict. Treat it as a trend filter, not an entry trigger.
How to actually trade moving average crossovers
1. Use the cross as a trend filter
Let the 50/200 cross decide which direction you're allowed to trade. After a golden cross, you favor longs and treat pullbacks as opportunities. After a death cross, you favor caution or shorts. It's the regime, not the trigger.
⚡ How AlgoatTV's Neural Engine Reads the Cross
The classic 50/200 cross above is the textbook standard — reliable, but slow. By the time the 200-day catches up, a big chunk of the move is already gone.
That's why our Neural Engine uses a 50/150 moving-average cross instead. The shorter 150-period anchor reacts to genuine trend shifts earlier than the 200, giving you confirmation closer to the turn — while still filtering out the low-timeframe noise that wrecks faster crossover settings.
Same logic, tuned for traders who can't afford to wait 200 candles to find out the trend already changed.
2. Time entries with a faster signal
Because the cross lags, you pair it with something faster for the actual entry: a pullback to a rising moving average, a momentum reset, a break of a small structure. The cross gives you the why; the faster tool gives you the when.
The lag problem — and seeing the cross sooner
The biggest frustration with the golden/death cross is timing: by the time the daily 50/200 cross officially prints, a chunk of the move is gone. Traders end up either acting late or guessing early. And on lower timeframes, the cross flips back and forth so often it becomes useless noise.
🧠 Neural Engine — the daily cross, on every timeframe
The Neural Engine on Algoat.TV tackles this directly with a daily-anchored Golden/Death Cross that stays visible on every timeframe you open — so you can watch the meaningful daily trend shift while trading a faster chart, instead of flipping back and forth or trusting a noisy intraday crossover. It also tracks longer-horizon "Era" MA crosses for the bigger structural picture.
It's one layer of a suite that reads 250+ technical-analysis evidence points per bar across 8 scoring engines into a single 0–100 Score — so the trend regime is already baked into the number you read, and you decide how to act on it.
A simple crossover strategy workflow
Establish the regime
Check the daily 50/200. Golden cross = bullish bias. Death cross = bearish/defensive bias. This frames everything.
Wait for a pullback
Don't chase the cross. In an uptrend, wait for price to pull back toward a rising moving average before looking to enter.
Time it with a faster tool
Use momentum turning back up or a small break of structure to time the entry within the bigger trend.
Define risk below the structure
Place your stop below the pullback low (or the rising MA). If the trend genuinely fails, you're out small.
Hold with the trend, decide for yourself
While the cross-confirmed trend holds, give winners room. The cross is context — you still make every call.
4 common moving average crossover mistakes
Buying right at the cross. It's a lagging confirmation, not a bottom. The smart entry is the pullback after, not the cross itself.
Trading crossovers in a range. Sideways markets produce endless whipsaw crosses. Crossovers are trend tools, full stop.
Using it on too low a timeframe. A 1-minute 50/200 cross is noise. The signal's power lives on the daily and higher.
Treating it as a standalone system. The cross sets bias; it doesn't manage trades. Pair it with timing and risk rules.
Frequently asked questions
QWhat is a golden cross?
A golden cross occurs when a shorter-term moving average — typically the 50-day — crosses above a longer-term one, usually the 200-day. It's widely interpreted as a bullish signal indicating that a longer-term uptrend may be beginning. Because it's based on past prices, it confirms a trend rather than predicting it.
QWhat is a death cross?
A death cross is the opposite of a golden cross: the 50-day moving average crosses below the 200-day. It's read as a bearish signal suggesting a longer-term downtrend may be starting. Like the golden cross, it lags — it tends to appear after a decline is already underway.
QAre golden and death crosses reliable?
They're reliable for confirming the big-picture trend, but unreliable for precise timing because they lag. They also whipsaw badly in sideways markets. The best use is as a trend filter that sets your directional bias, paired with a faster tool to time actual entries.
QWhat moving averages are used for the golden/death cross?
The classic version uses the 50-day and 200-day moving averages on the daily chart. Some traders use other combinations (like the 50/100), but the 50/200 is the standard that most market participants watch — which is part of why it carries weight.
QCan I see the golden cross on lower timeframes?
The raw cross on low timeframes is usually too noisy to be useful. Algoat.TV's Neural Engine solves this with a daily-anchored Golden/Death Cross that stays visible on every timeframe, so you can keep the meaningful daily trend in view while trading a faster chart.
Keep the daily trend in view — on every chart.
Daily-anchored Golden/Death Cross + a 0-100 trend read, on any timeframe. Free for 7 days.
🚀 Start Your 7-Day Free TrialDisclaimer: This article is educational and not financial advice. Algoat.TV indicators are quantitative analysis tools — they do not provide trade signals, recommendations, or guaranteed outcomes. Trading involves risk of loss. Always do your own research and trade your own plan.