Best Day Trading Indicators for TradingView (2026)
Five indicators that actually matter intraday — explained in plain English. Plus the mistake that quietly wrecks most day traders, and the one-number fix.
The best day trading indicators on TradingView are VWAP (intraday fair value), the 9 & 20 EMA (trend direction), RSI (momentum), Volume (conviction), and ATR (stop distance). But here's the part nobody tells you: no single indicator wins alone. The edge comes from confluence — using three or four that agree, not ten that argue.
Open any beginner's chart and you'll see the same thing: eight indicators stacked on top of each other, half of them flashing green, the other half red, and a trader frozen in the middle trying to decide who to believe.
Day trading punishes that. You have minutes — sometimes seconds — to read a chart and act. You don't have time to mediate an argument between ten indicators. So this guide does two things: it teaches you the five indicators that genuinely earn their place on an intraday chart, and then it shows you how to stop drowning in them.
Why most day traders get this wrong
The instinct is understandable. You lose a trade, you go looking for the indicator that would have warned you, and you bolt it onto the chart. Repeat that twenty times and you've built a cockpit you can't fly.
Analysis paralysis
Three indicators say go, three say wait. You hesitate, miss the move, then chase it late.
Hidden redundancy
RSI, Stochastic, and MACD are all momentum tools. Stacking them isn't confirmation — it's the same vote counted three times.
Too slow for intraday
Reading ten panels takes focus you don't have when a 5-minute candle is closing against you.
The fix isn't a better indicator. It's fewer, better-chosen indicators that each answer a different question. Here are the five.
The 5 best day trading indicators (and how to actually use each)
1. VWAP — the intraday anchor
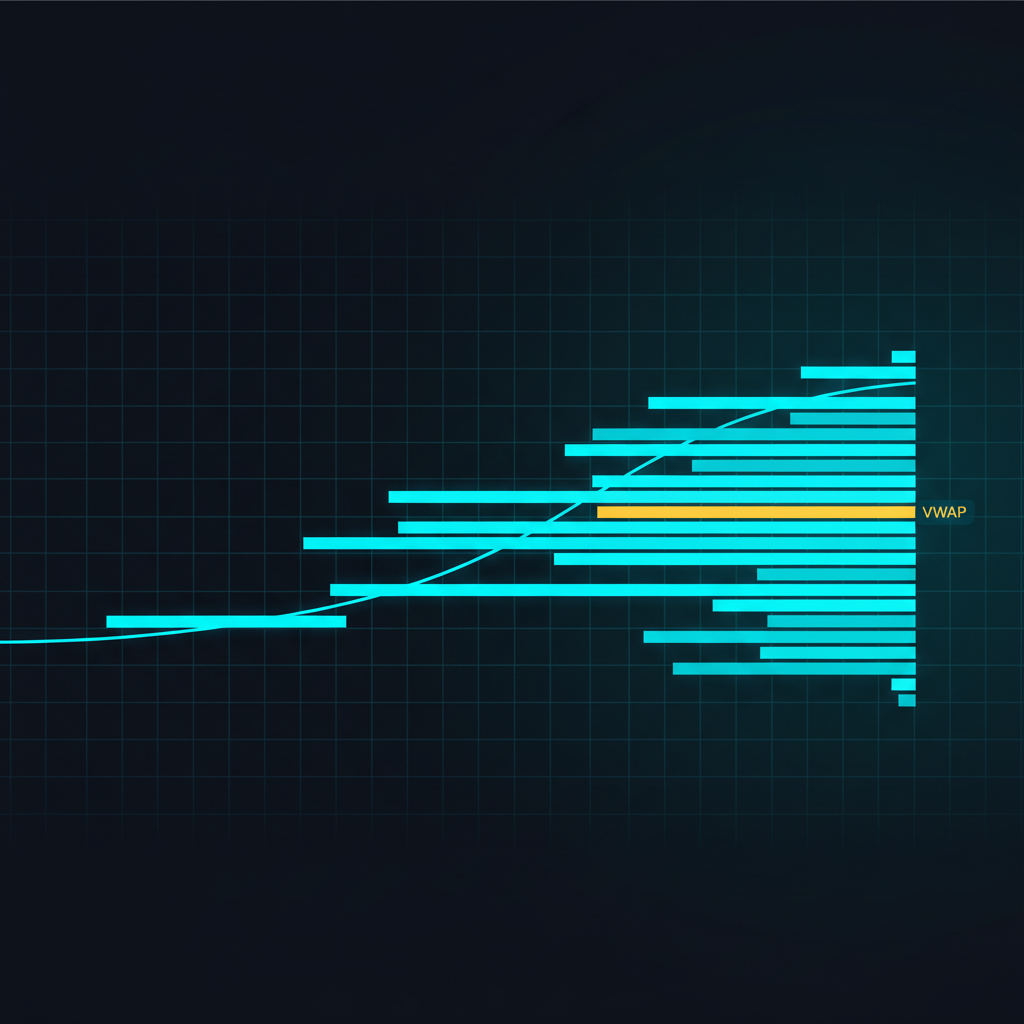
VWAP (Volume-Weighted Average Price) is the single most important line on a day trader's chart. It's the average price of the day, weighted by volume — so it shows you the price level where the most real money actually changed hands. Institutions use it as a benchmark, which is exactly why it works.
Simple read: price above VWAP = buyers in control. Price below = sellers in control. Pullbacks to VWAP are where intraday trends often resume.
2. The 9 & 20 EMA — trend at a glance
Two exponential moving averages do almost everything a day trader needs for trend. The 9 EMA tracks the short-term pulse; the 20 EMA tracks the underlying trend. When the 9 is above the 20 and both are rising, you're in an uptrend. The opposite for downtrends.
The space between them is your trend "engine." When they're tightly woven together, the market is undecided — that's your cue to stand down.
3. RSI — momentum & exhaustion
RSI (Relative Strength Index) measures the speed of price moves on a 0–100 scale. Above 70 is often called "overbought," below 30 "oversold" — but the real value for day traders is divergence: when price makes a new high but RSI doesn't, the move is weakening under the surface.
Don't trade RSI alone. Use it to confirm what VWAP and your EMAs already suggest.
4. Volume — the conviction check
Price tells you what. Volume tells you how much it matters. A breakout on high volume is real intent. The same breakout on thin volume is often a trap that snaps right back.
Volume is the lie-detector of your chart. It's not a standalone entry — it's the filter that keeps you out of fakeouts.
5. ATR — where your stop belongs
Most day traders blow up not because their reads are wrong, but because their stops are too tight. ATR (Average True Range) measures how much an asset typically moves. It turns "I'll risk a few cents" into a number that respects the asset's actual volatility.
Place your stop a multiple of ATR away from entry, and normal noise stops knocking you out of good trades.
The real secret: confluence, not collection
Notice that each of the five answers a different question: fair value, trend, momentum, conviction, risk. That's the whole point. You're not stacking duplicates — you're building a checklist that covers the chart from five angles.
A clean intraday long, in plain terms, looks like this: price is above VWAP, the 9 EMA is above the 20, RSI has room to run, the latest push came on rising volume, and ATR tells you where a sensible stop sits. When four or five line up, you have confluence. When they're split, you have a coin flip — and you pass.
The catch — and a faster way to read all five at once
Here's the honest problem with the checklist above: it's correct, but it's slow. Reading five indicators, weighing them against each other, and deciding — in the seconds a day trade gives you — is genuinely difficult. That's where most of the hesitation, second-guessing, and missed entries come from.
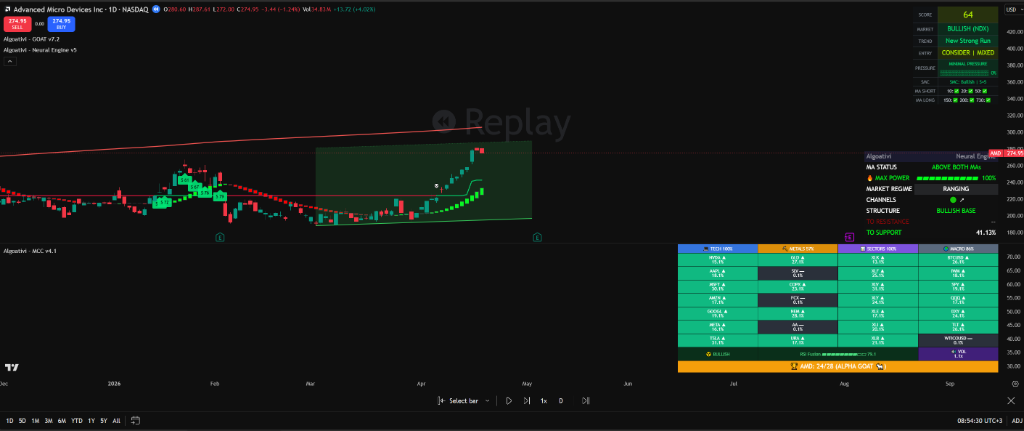
This is the exact problem the Algoat.TV indicator suite was built to solve. Instead of you eyeballing five panels, it runs the math for you: the G.O.A.T. Toolkit evaluates 250+ technical-analysis evidence points on every bar — trend, momentum, RSI, volume, volatility, Smart Money structure and more — across 8 scoring engines, and compresses all of it into a single 0–100 Score.
One number instead of ten panels
The Score is the confluence check — done for you, on every bar, in real time. Higher means more factors agree on strength. Lower means they don't. You still decide. The math just stops being your bottleneck.
It's not a buy or sell button, and it never tells you what to do — that's the line we don't cross. It's a fast, unbiased read of the chart so you can decide with a clear head. And if you want a sanity check, the AI Quant co-pilot (Powered by Anthropic Claude) reads a screenshot of your chart and gives you a second opinion on what the math is saying — in any language.
A simple day-trading workflow you can copy
Set the stage
Add VWAP and the 9 & 20 EMA. These two alone tell you fair value and trend before you do anything else.
Check the trend filter
Only hunt longs when price is above VWAP and the 9 EMA is above the 20. Reverse for shorts. No filter, no trade.
Confirm with momentum & volume
Is RSI supportive? Did the move come on real volume? Two yeses and you have confluence.
Define risk with ATR
Place your stop 1.5–2× ATR from entry, then size the position to that distance. Risk first, target second.
Decide — or walk away
If the factors agree, take it. If they're split, cash is a position. The best day traders skip more than they take.
5 common indicator mistakes that quietly cost day traders
Stacking duplicates. RSI + Stochastic + MACD is one vote, not three. Pick one momentum tool.
Using VWAP on the wrong timeframe. It resets daily — it's an intraday tool, full stop.
Treating "overbought" as a sell signal. Strong trends stay overbought for hours. RSI confirms; it doesn't command.
Fixed-dollar stops. Ignoring volatility (ATR) means your stop is too tight on wild days and too loose on calm ones.
Trading every signal. Indicators generate endless triggers. Confluence — not activity — is the edge.
Frequently asked questions
QWhat is the single best indicator for day trading?
If forced to pick one, most intraday traders choose VWAP — it shows the volume-weighted fair value institutions benchmark against. But no indicator works alone. VWAP tells you who's in control; you still need trend (EMAs), momentum (RSI), and conviction (volume) to build a real setup.
QHow many indicators should a day trader use?
Three to five, each answering a different question (fair value, trend, momentum, conviction, risk). Beyond that you hit diminishing returns and analysis paralysis. The goal is coverage without redundancy — or a tool that reads them together for you into one score.
QWhat are the best indicator settings for intraday charts?
Common starting points: VWAP at default, EMA lengths of 9 and 20, RSI at 14, and ATR at 14. These are reference points, not rules — volatile assets and faster timeframes often want shorter lengths. Test on replay before risking capital.
QDo day trading indicators repaint?
Some do — meaning their historical signals shift after the fact, which makes backtests look better than reality. Always prefer indicators whose values are locked once a bar closes. Algoat.TV's suite is built on closed-bar, no-repaint math for exactly this reason.
QCan one tool replace all of these indicators?
It can't make the decision for you — but it can do the reading. The G.O.A.T. Toolkit evaluates 250+ technical-analysis evidence points per bar across 8 engines and compresses them into one 0–100 Score, so you read confluence at a glance instead of mentally juggling five panels.
Read any chart in 10 seconds — not ten panels.
Try the full Algoat.TV suite free for 7 days. No credit card. Cancel anytime.
🚀 Start Your 7-Day Free TrialDisclaimer: This article is educational and not financial advice. Algoat.TV indicators are quantitative analysis tools — they do not provide trade signals, recommendations, or guaranteed outcomes. Trading involves risk of loss. Always do your own research and trade your own plan.