Momentum Trading Setups: 3 Timeless Patterns That Still Work (2026)
Almost every consistently profitable momentum trader in history has made the bulk of their money from a tiny number of repeating momentum trading setups. Not dozens of indicators, not secret signals. Three core patterns that keep showing up because the thing that drives them never changes: human behavior around price.
The three most durable momentum trading setups are the breakout (entering a strong stock out of a tight consolidation), the episodic pivot (a surprise earnings gap on a previously neglected stock), and the parabolic reversal (a snapback after a stock gets overextended). All three are recognizable, repeatable structures documented for over a century.
"There is nothing new in Wall Street. There can't be because speculation is as old as the hills. Whatever happens in the stock market today has happened before and will happen again." That line was written in 1923. It is still the most important sentence in trading.
This guide breaks down those three setups, where they came from, why they keep working, and how to recognize them. Each one has a dedicated deep-dive linked below. This is education, not advice. Nothing here is a recommendation to buy or sell anything (NFA).
Why do the same momentum patterns repeat for a century?
Markets are not random because the participants are not random. Fear, greed, the urge to chase, the urge to lock in a gain too early, the institution that has to accumulate millions of shares without tipping its hand. These forces leave the same fingerprints on a chart in 1925 and in 2026.
A stock breaking out of a tight base looks the same whether it's a railroad in the 1920s or a semiconductor today, because in both cases supply has dried up and demand is overwhelming it. A stock gapping up on a surprise looks the same because surprise repricing is surprise repricing. A stock going vertical and then snapping back looks the same because exhaustion is exhaustion.
You are not predicting the future. You are recognizing a structure that has paid out, in the same shape, for a hundred years.
Where these setups came from: a 100-year lineage
These patterns weren't invented by any single modern trader. They were discovered, documented, and refined across generations.
Jesse Livermore
Traded "pivotal points" and the "line of least resistance," pyramided into winners, and cut losers fast. The breakout and the exhaustion reversal both trace directly to his work.
Richard Wyckoff
Mapped accumulation and distribution, how a "Composite Operator" quietly builds a position in a base and unloads it into a climax. That's the engine underneath the breakout and the parabolic top.
Nicolas Darvas
Turned about $36,000 into a reported $2,000,000 trading the "Darvas Box," buying breakouts out of tightening boxes and trailing the move. He did it while touring the world as a dancer, using only telegrams and weekly quotes.
William O'Neil
Systematized it into CANSLIM and the "cup-with-handle" base, and popularized relative strength and the importance of a fundamental catalyst (earnings), the backbone of the episodic pivot.
Stan Weinstein
Framed the whole thing as Stage Analysis: Stage 1 base, Stage 2 advance, Stage 3 top, Stage 4 decline. The breakout is a Stage 1 to Stage 2 transition.
Different names, same three structures. When you trade these setups, you are standing on a century of documented evidence, not a guru's opinion.
The 3 setups at a glance
1. The Breakout
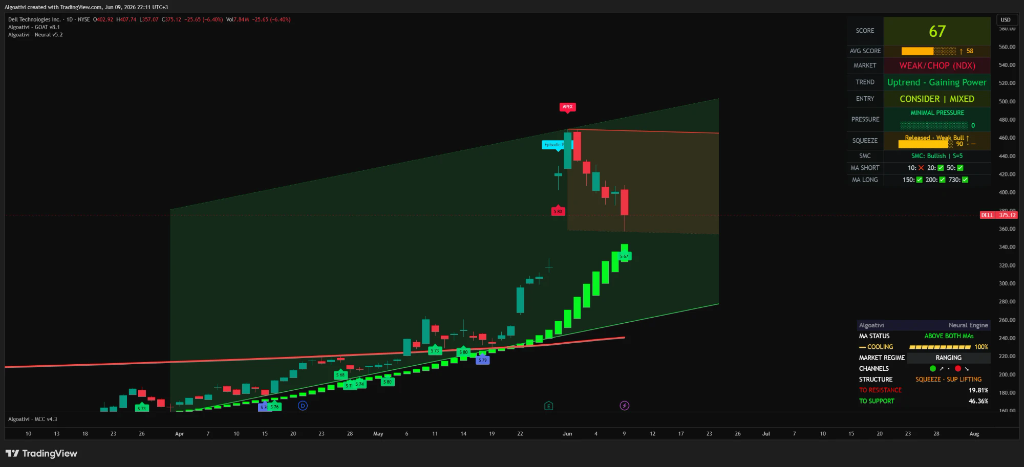
A stock makes a strong move, then pauses and tightens into an orderly consolidation: higher lows, narrowing range, "surfing" its rising 10-, 20-, and sometimes 50-day moving averages. When it breaks the top of that range on volume, demand has won. You enter on the breakout, risk a small, defined amount to the low of the day, and trail the winner with a moving average. The whole point: a low-risk entry on a stock already proven to be strong, so a small risk can turn into a multiple of itself.
→ Read the full guide: The Breakout Setup
2. The Episodic Pivot (EP)
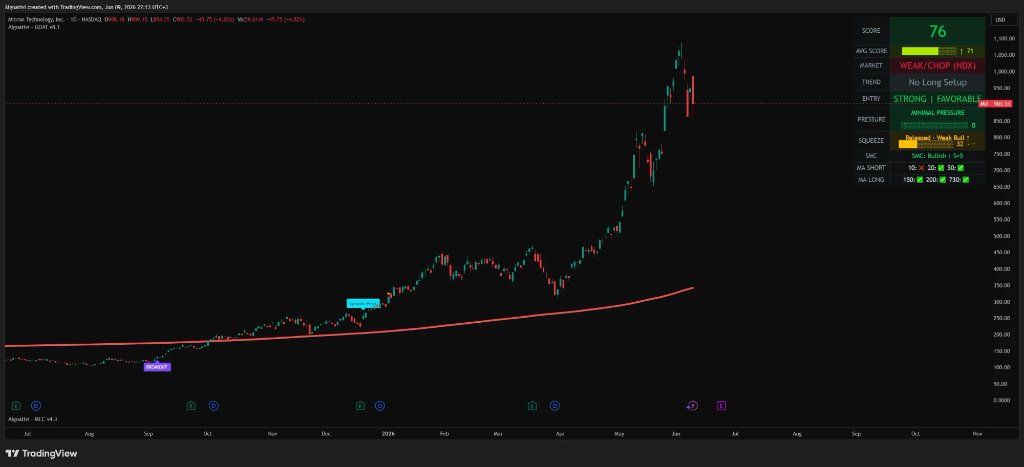
A neglected stock, one that hasn't run in the last 3 to 6 months, gets hit with surprise good news, usually an earnings beat with strong guidance. It gaps up 10%+ on heavy volume. That surprise can kick off a move that lasts months, because the market is repricing the company in real time and most participants are slow to react.
→ Read the full guide: The Episodic Pivot (EP)
3. The Parabolic Reversal
Stocks are like rubber bands. Stretch one too far, too fast, up 50 to 100%+ (or 300 to 1000% for small caps) in a handful of days, several green days in a row, and it tends to snap back violently toward its moving averages. This is the riskiest of the three and demands the tightest discipline, but the reversal back to the 10/20-day MA is a repeatable, tradeable event.
→ Read the full guide: The Parabolic Short
The 3 setups compared
| Setup | What triggers it | Risk | Typical reward | Best for |
|---|---|---|---|---|
| Breakout | A strong stock breaks the top of a tight consolidation on volume | Low (small stop to the low of the day) | 30 to 50x risk if the trend runs | Trend continuation in proven leaders |
| Episodic Pivot | A neglected stock gaps up 10%+ on a surprise earnings beat and strong guidance | Medium (gap can be volatile) | 10 to 30x risk over weeks to months | Catching a fresh re-rating early |
| Parabolic Reversal | A stock goes vertical, up 50 to 100%+ (or 300 to 1000% for small caps) in days, then exhausts | Highest (demands the tightest discipline) | 5 to 10x risk on the snapback to the MA | Experienced traders fading exhaustion |
Reward multiples describe the asymmetric shape of each setup when it works, not a promise. The risk on every one is small and pre-defined, which is what makes the math viable.
The thread that connects all three
Strip away the differences and the same principles run through every one.
Relative strength first
You hunt where the energy is, typically the small fraction of stocks that are up the most over the last 1-, 3-, and 6-month windows. Weak stocks rarely give you these setups.
A low-risk, defined entry
Every setup has a clean place to enter and a clean place to be wrong. The stop is small and pre-defined, often no wider than the stock's average daily range (ADR).
Asymmetric reward
Because the risk is tiny and defined, a single winner can pay for many small losses. Most momentum traders take many small losses and a few large winners. The math works because the losers are capped and the winners are let run.
Moving averages as the spine
The 10-, 20-, and 50-day moving averages do the heavy lifting: defining the consolidation, trailing the winner, and acting as the target on a reversal.
The hard part isn't the setup. It's seeing it.
Here's the honest truth that no course tells you: the rules above are simple. Executing them is not, because the bottleneck is perception under pressure. There are thousands of stocks. The setup appears for a moment, on one timeframe, while five other things on your screen scream for attention, and your own emotions push you to chase the wrong one and freeze on the right one.
- Chasing a stock that has already run instead of waiting for the low-risk entry, so the stop is too far away and the math breaks.
- Trading the right pattern in the wrong market. In hostile broad conditions, the right move is often fewer or no trades.
- Cutting winners early and letting losers run, the exact inverse of what makes momentum profitable.
- Forcing a setup on a weak stock with no relative strength, where these patterns rarely pay.

How Algoat.TV reads these setups
The rules are simple. Seeing them in real time across thousands of charts is the hard part. That is exactly the problem the Algoat.TV indicator suite was built to solve, not by telling you what to do, but by doing the math objectively so you can decide. It is a reading of the math, never an instruction or a signal to buy:
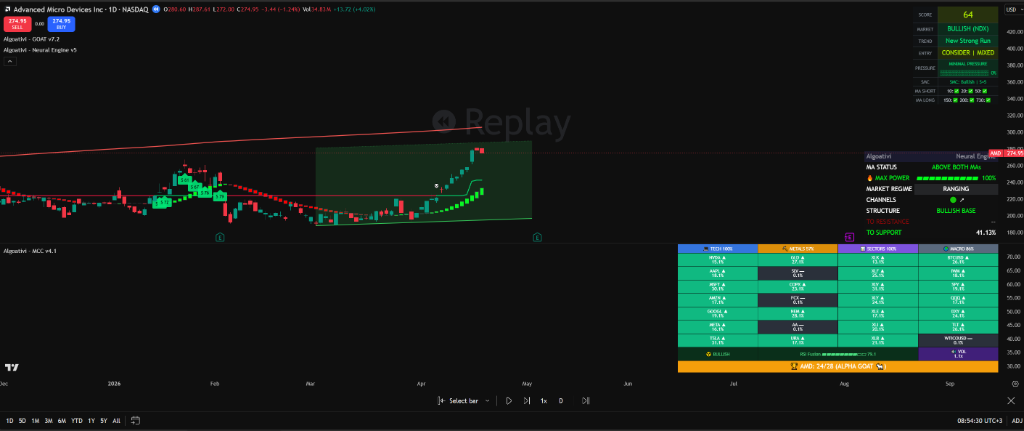
- G.O.A.T. (General Overlay Analysis Toolkit) computes a single 0-100 score every bar from 250+ technical calculations per bar and flags the structures behind these setups, consolidation breakouts, episodic-pivot conditions, and parabolic or exhaustion extension, so a valid setup isn't something you have to spot by eye on chart number 1,847.
- Macro Command Center (MCC) runs a 28-asset relative-strength radar, ranking your stock against the broader market, so "is this actually a leader right now?" stops being a guess.
- The Neural Engine and the suite track the same 10/20/50-day moving averages these setups live on, with ATR-based trailing stops, so the trail and the risk are computed for you.
- The Trinity Wave fuses all three engines into one verdict, Strong Bull to Strong Bear, with conviction-turn markers for exactly the moments these setups turn.
You stay in the driver's seat. And if you want a second opinion, you can take a screenshot of your chart and paste it into the AI Quant, Powered by Anthropic Claude, a separate layer that reads your chart and gives a second math reading in any language.
Start your free 7-day trial, no card →
Full GOAT Membership. No card required. 30-day money-back if you stay. Cancel anytime.
Frequently asked questions
What are the best momentum trading setups?
Do these setups work in all markets?
Do I need a high win rate to be profitable with momentum setups?
How is this different from a signal service?
See your charts read this way
The setups are timeless. The edge is seeing them before everyone else.
Start your free 7-day trial →