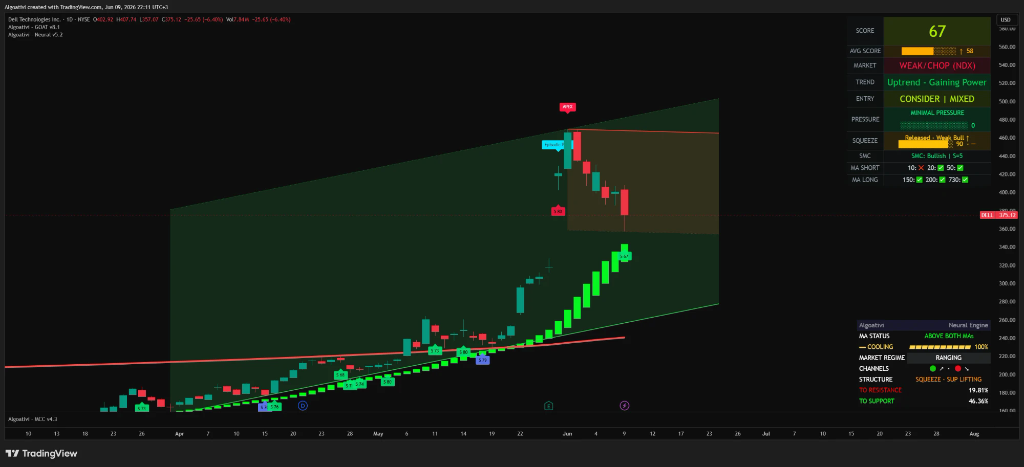
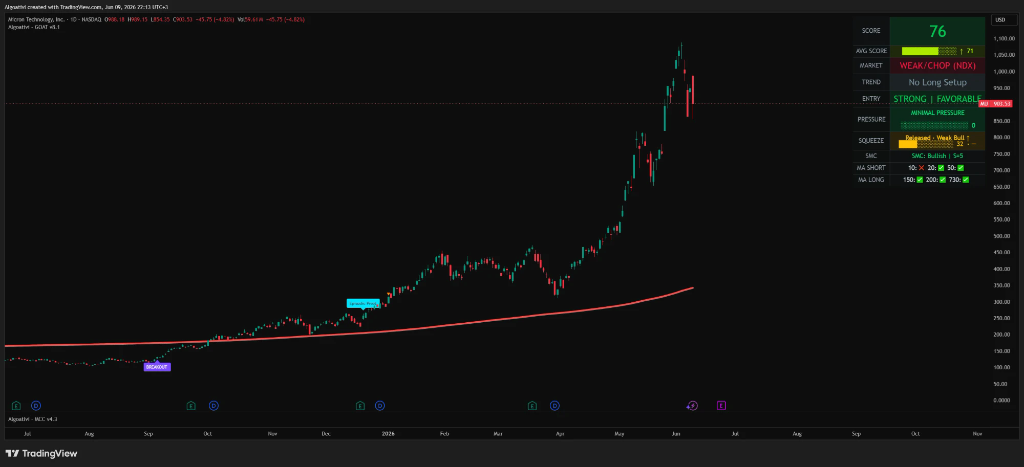
Episodic Pivot (EP): How Earnings Surprises Can Trigger Multi-Month Repricing
Most major market moves do not begin quietly. They often begin with new information that changes how investors value a company.
A stronger-than-expected earnings report, revised guidance, a regulatory decision, or a major product announcement can force the market to reconsider assumptions that had been in place for months. When that reassessment produces an abrupt change in price, volume, and market attention, it is often described as an episodic pivot, or EP.
An EP is not a prediction, recommendation, or automatic signal. It is an educational framework for studying how markets react when unexpected information materially changes expectations.
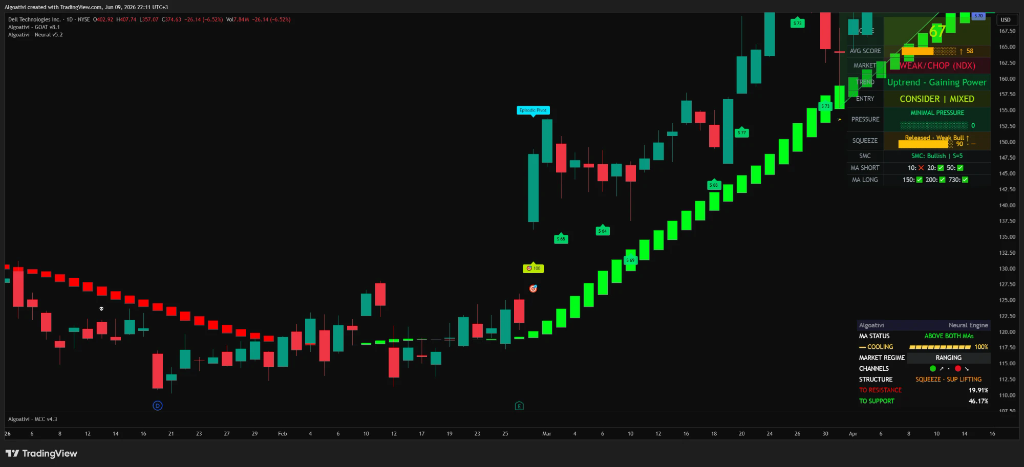
What is an episodic pivot?
An episodic pivot begins when a catalyst causes investors to reassess a company’s future prospects.
Common catalysts include:
- Earnings results that differ materially from expectations
- Significant changes to company guidance
- Regulatory or political decisions
- Clinical-trial or FDA developments
- Major contracts, partnerships, or product announcements
- Structural changes affecting an industry
Earnings-related events are frequently used to study EPs because they provide measurable information. Revenue, earnings, margins, guidance, and management commentary can all change the assumptions behind a company’s valuation.
The important point is not simply that the price moved. The question is whether the underlying information was significant enough to create a lasting change in market expectations.
Four characteristics commonly associated with an EP
No single measurement confirms an episodic pivot. Analysts generally look for several conditions appearing together.
A meaningful price gap
A large gap indicates that the market is processing information that was not reflected in the previous closing price. Historical studies often use approximately 10% as a reference, but significance depends on normal volatility, liquidity, market capitalization, and the catalyst.
Unusually high volume
Volume helps show how broadly the new information is being acted upon. Meaningful events may produce turnover far above the stock’s recent average, but volume must always be interpreted relative to the company’s own history.
Fundamental evidence
For an earnings-related EP, revenue growth, earnings growth, improving margins, stronger guidance, or a material surprise should help explain the reaction. Price movement without a changed business narrative may be less durable.
Limited prior appreciation
If a stock had already risen substantially during the previous three to six months, positive expectations may already be reflected in its price. A previously overlooked company can produce a larger reassessment when new evidence challenges the prevailing view.
Meaningful repricing versus an ordinary gap
| Characteristic | Stronger repricing evidence | Weaker evidence |
|---|---|---|
| Market catalyst | Material and unexpected information | Minor or widely anticipated news |
| Price reaction | Large relative to normal volatility | Within the usual range |
| Volume | Significantly above recent averages | Thin or close to normal |
| Business results | Clear improvement or major surprise | Limited fundamental change |
| Previous trend | Quiet, overlooked, or range-bound | Already extended before the event |
| Follow-through | Interest remains elevated over time | Initial reaction quickly fades |
How an EP develops over time
An episodic pivot is better understood as a sequence than as a single candle.
Before the event
The company may be range-bound, declining, or receiving limited attention. Volume and volatility are often relatively subdued.
The catalyst
New information changes the outlook. Price adjusts rapidly because previous assumptions no longer match the available evidence.
Initial confirmation
Analysts observe whether volume remains elevated, whether price holds most of the initial change, and whether attention persists after the first reaction.
Longer-term development
Some examples become sustained trends as estimates change and market participation expands. Others fade quickly. The event itself never guarantees a multi-month move.
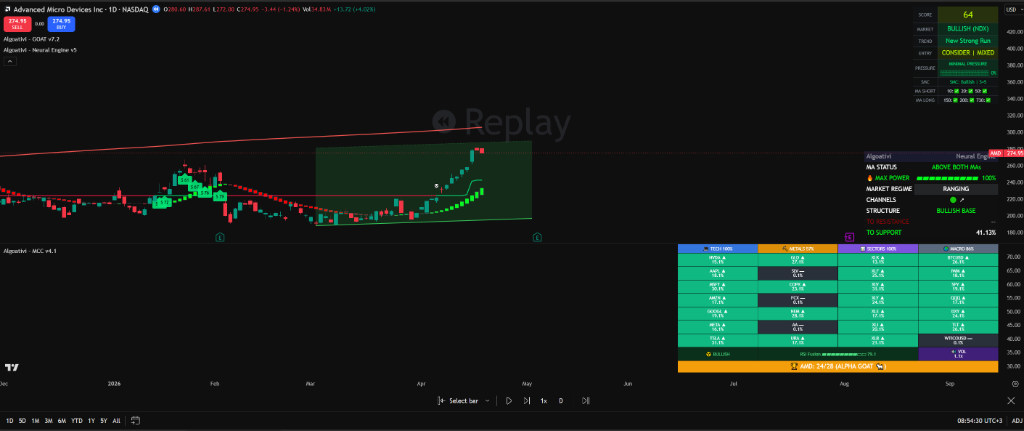
Why prior neglect matters
Surprise is relative to expectations. A strong quarter from a company that is already widely followed and highly valued may produce only a limited reassessment. Similar results from an overlooked company can create a much larger reaction because fewer participants anticipated the change.
This process can unfold gradually:
- The company releases unexpected information.
- Analysts update forecasts and valuation assumptions.
- Institutional investors conduct further research.
- Market attention and liquidity increase.
- The new expectations become progressively reflected in price.
The analytical value of the EP framework comes from studying this transition—not from assuming that every surprise will produce the same result.
Common interpretation errors
Treating every gap as an EP
Many gaps result from temporary sentiment, low liquidity, or information with little long-term effect on the business.
Ignoring the catalyst
Without understanding what changed, it is difficult to judge whether the reaction represents genuine repricing.
Ignoring the previous trend
A company that had already appreciated significantly may react differently from one overlooked for months.
Treating a label as a recommendation
Technical labels summarize calculated conditions. They cannot assess personal circumstances, objectives, or suitability.
Using hindsight as proof
Historical examples often look obvious after the full move is visible. At the time, the eventual outcome remained uncertain.
How AlgoatTV helps analyze an episodic pivot
AlgoatTV is designed to organize technical evidence—not to recommend transactions.
- The G.O.A.T. Toolkit calculates more than 250 technical-analysis evidence points on every bar and highlights changes in gap behavior, volume, momentum, volatility, and trend structure.
- The Macro Command Center provides relative-strength context across multiple time windows.
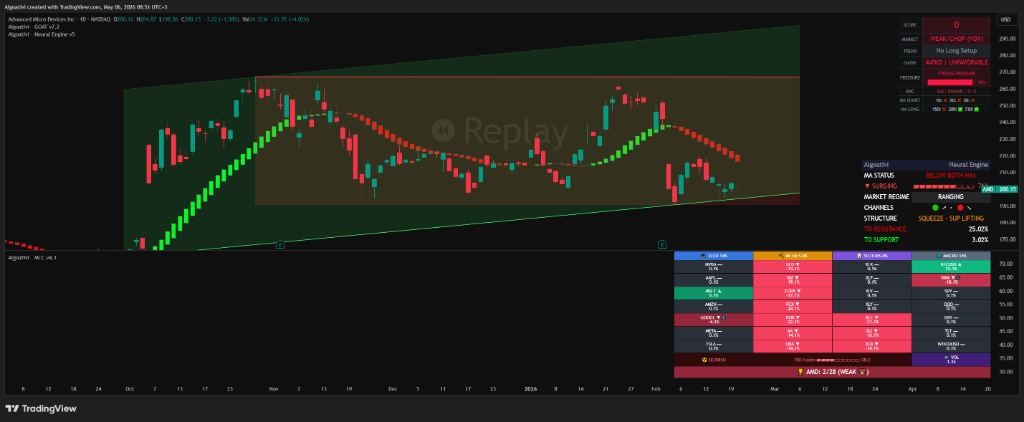
- The Neural Engine and Trinity Convergence Wave visualize trend development, momentum changes, volatility, and moving-average structure after a catalyst.
- AI Quant, powered by Anthropic Claude, can provide a second educational reading of an uploaded chart and explain visible evidence in the user’s preferred language.
These tools do not know a user’s financial situation and do not provide personalized financial advice. They organize market data so users can conduct their own research and reach their own conclusions.
Frequently asked questions
Is an episodic pivot a buy signal?
No. An EP is a framework for studying how markets respond to unexpected information. It does not determine suitability or predict what a security will do next.
Does an EP have to be caused by earnings?
No. Earnings and guidance are common because they provide measurable changes in outlook. Regulatory decisions, clinical results, major contracts, and structural industry developments can also produce repricing events.
Does a 10% gap confirm an episodic pivot?
No. A percentage threshold is only a reference. The gap must be considered alongside normal volatility, volume, business results, prior price behavior, and subsequent market response.
Why is high volume important?
Elevated volume suggests the information is being processed by a broader group of participants. It does not guarantee that the initial reaction will continue.
Why does the previous trend matter?
If positive expectations were already reflected in price, new information may produce less reassessment. A previously overlooked company may experience a larger change when the catalyst challenges the prevailing view.
Can AlgoatTV identify an episodic pivot?
AlgoatTV can highlight technical conditions commonly associated with an EP, including gaps, unusual volume, momentum changes, and relative strength. These readings are analytical observations, not recommendations or guarantees.
Understanding repricing through evidence
Episodic pivots demonstrate how quickly expectations can change when new information challenges the market’s previous view of a company.
The framework brings several forms of evidence together: the significance of the catalyst, the size of the reaction, relative volume, changes in business performance, previous market behavior, and whether attention persists after the initial event.
No single factor determines the outcome. The purpose of the analysis is to understand what changed, measure the market’s response, and separate evidence from assumption.