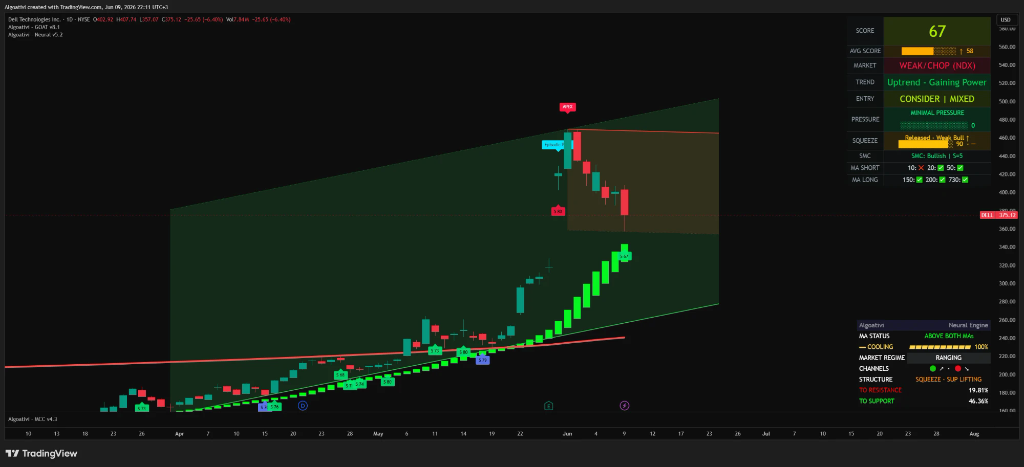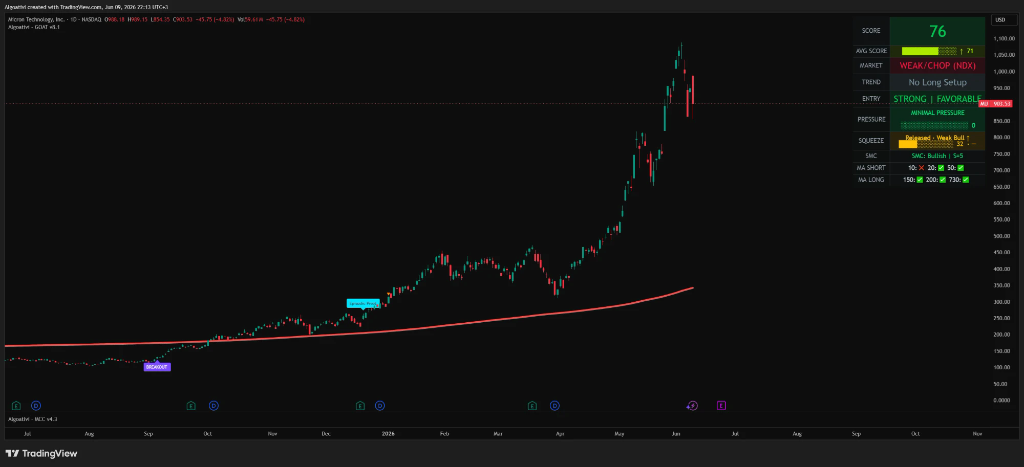
The Breakout Setup: How to Trade Consolidation Breakouts (2026)
The breakout is the oldest momentum trading strategy there is. Nicolas Darvas traded a version of the consolidation breakout by telegram in the 1950s and turned a few thousand dollars into a reported two million. William O'Neil built CANSLIM around it. Stan Weinstein called it the Stage 1 to Stage 2 transition. The names change; the structure doesn't.
This guide walks the setup end to end: what has to happen before the entry, the exact trigger, where the stop goes, and how to manage the winner. It's education, not advice (NFA).
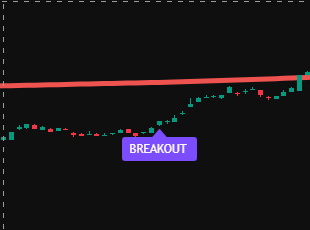
A consolidation breakout is when a stock that has already made a strong move pauses into a tight, orderly range along a rising moving average, then breaks above that range on volume. You enter on the break, place the stop at the low of the day (never wider than the stock's ADR), and trail the rest with a moving average.
What is a consolidation breakout?
A breakout worth trading is not "price pokes above a line." It's the resolution of a specific three-act structure: a strong prior move, an orderly consolidation, then the break itself.
You're not buying a random level. You're buying the moment a proven leader resolves a period of tightening tension in the direction of its trend, with a tiny, defined risk. Get those three acts in order and the math works in your favor. Skip one and you're guessing.
The three phases, step by step
Every clean consolidation breakout walks through the same sequence. Here is what each phase looks like and what you are actually watching for.
The prior move
The setup starts with a substantial advance, often 30 to 100%+, usually over a few days to a few weeks. This move is the evidence that institutions want the stock. No prior strength, no setup. A practical filter: focus on the top 1 to 2% of stocks that are up the most over the 1-month, 3-month, and 6-month windows. That's relative strength, and it's where breakouts that actually run tend to come from.
The consolidation
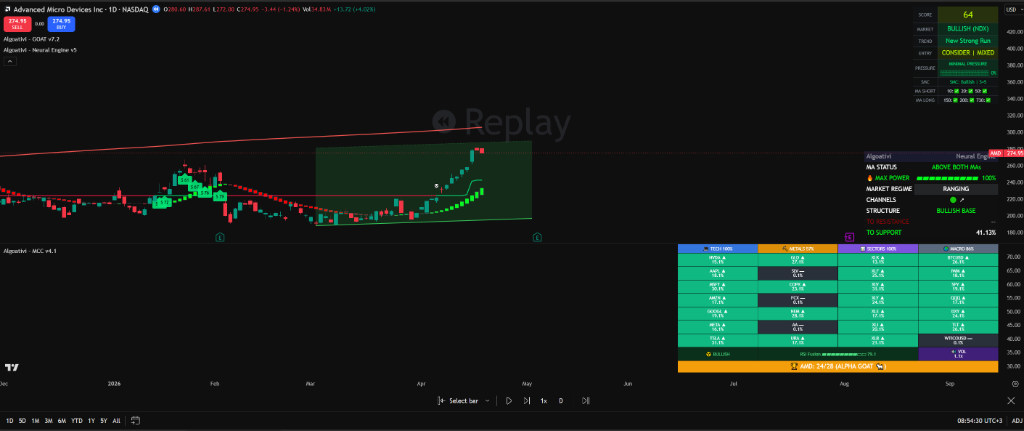
After the move, the stock pauses in an orderly way: higher lows and a tightening range as the base matures. Price "surfs" its rising 10- and 20-day (sometimes 50-day) moving averages, pulling back, holding, and coiling. This phase typically lasts 2 weeks to 2 months. The tightening is the whole point: a narrowing range means sellers are drying up. The longer and tighter the coil along a rising moving average, the cleaner the eventual break and the smaller your risk.
The entry trigger
The classic, low-risk entry is the opening range high (ORH): a break above the high of the first candle of the day. That can be the first 1-minute, 5-minute, or 60-minute candle, depending on how much room you want to give it. You don't even need an intraday chart; some traders simply buy a clean break on the daily. ORH works because it lets the market show its hand for the session before you commit, then enters in the direction of the proven trend the moment buyers take control.
Where the stop goes
This is the part that makes or breaks the setup.
- Stop at the low of the day. Clean, objective, defined before you enter.
- Critically: the stop should never be wider than the stock's ADR or ATR. If the average daily range is 5%, your stop shouldn't be wider than ~5%. If the ATR is 50 cents, your stop shouldn't be wider than ~50 cents.
Why the ADR cap matters: the entire edge of this setup is the asymmetry between a small, fixed risk and a large potential reward. The moment your stop gets wide, that math breaks and a "good setup" becomes a bad trade. If the only valid stop is wider than the ADR, the setup isn't tight enough. Pass.

Breakout base types compared
You'll see this base under many names. They're all variations on one idea: supply contracting under steady demand. Here's how the common ones read on the chart.
| Base / pattern | What it looks like | The tell | Notes |
|---|---|---|---|
| Flat channel | Price chops sideways in a roughly horizontal band after the advance. | A clean, defined ceiling with higher lows pressing into it. | The simplest base; the break is a clear push above the band's top. |
| Flag / Pennant | A short, tight pullback or small coil that drifts slightly against the trend. | Range narrows fast over just a few sessions. | Often the briefest base; resolves quickly in the direction of the prior move. |
| Triangle (symmetrical / descending) | Converging trendlines as highs and lows compress toward a point. | Each swing gets smaller; volatility coils down to a pivot. | Symmetrical or descending, it's still supply contracting under steady demand. |
| Cup-with-handle | O'Neil's rounded recovery (the cup) followed by a small late pullback (the handle). | The handle is the final, tightest shakeout before the break. | Usually a longer, deeper base; the handle is the low-risk entry zone. |
Managing the winner
You've entered, the stock is moving. Now what:
Take partial profit into strength
A common approach is to sell 1/3 to 1/2 of the position after 3 to 5 days, then move the stop on the rest to break even. Now the trade is risk-free and you're holding a runner with house money.
Trail the rest with a moving average
Trail the remaining position with the 10- or 20-day moving average: the 10-day for faster movers, the 20-day to give a slower stock more room. The exit trigger is the first daily close below that average. An intraday poke doesn't count.
That's how a small initial risk becomes a multiple of itself: cap the downside, then let the trend carry the rest.
The role of the broad market
These entries are low-risk attempts, but the environment decides how many of them work. In a strong, trending market, breakouts follow through and can run for multiples of your risk. In a hostile or choppy market, more of them fail and chop you up.
The disciplined response to a bad market is simple and unglamorous: fewer trades, smaller size, or no trades at all.
Common mistakes
- Chasing extended price. If you didn't get the ORH, don't buy it 8% higher. The stop is now too wide and the math is gone.
- Buying a sloppy base. Wide, wild consolidations with lower lows aren't tightening, they're distributing. Wait for the orderly coil.
- Ignoring the ADR cap. A "great" stock with a stop twice its ADR is not a great trade.
- Bailing on intraday noise. The trail is the first close below the MA, not the first wick.
- Trading breakouts in a bad tape. The setup is fine; the market isn't.
How Algoat.TV reads this setup
The breakout is simple to describe and brutal to spot in real time across thousands of charts. That's the job the Algoat.TV indicators do, objectively, as a reading, never as an instruction:
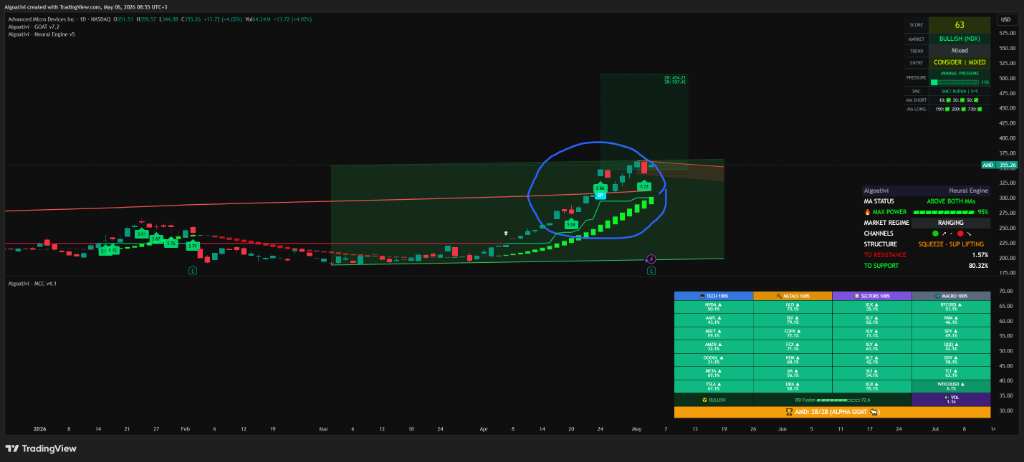
- The G.O.A.T. (General Overlay Analysis Toolkit) scores consolidation and breakout conditions into its 0-100 reading and flags breakout and near-breakout structure, so a valid base isn't something you have to eyeball.
- It tracks the same 10/20/50-day moving averages the consolidation surfs, and applies ATR-based trailing stops, so the trail and the ADR-sized risk are computed for you.
- The Macro Command Center (MCC) relative-strength radar confirms whether the stock is genuinely a leader over the 1/3/6-month windows before you ever take the break.
That's the indicator layer: pure math, more than 250+ technical calculations per bar, no opinions. On top of it sits a separate layer, the AI Quant, Powered by Anthropic Claude. You take a screenshot of your TradingView chart with the indicators on it, paste it in, and get a second math reading on what you're looking at, in any language. You stay in the driver's seat. The math just stops being a guess.
Start your free trial, no card →
Full GOAT Membership. No card required. 30-day money-back if you stay. Cancel anytime.
Frequently asked questions
What is a consolidation breakout?
Where do you put the stop on a breakout trade?
How do you take profits on a breakout?
What time frame is best for breakouts?
See your charts read this way
The setups are timeless. The edge is seeing the tight base, the leader, and the trail before everyone else, as a reading you act on yourself.
Start your free trial →