Divergence Trading: RSI & Volume Divergence Explained
When price says one thing and momentum says another, pay attention. Learn to read divergence — the early warning that a move is running out of fuel.
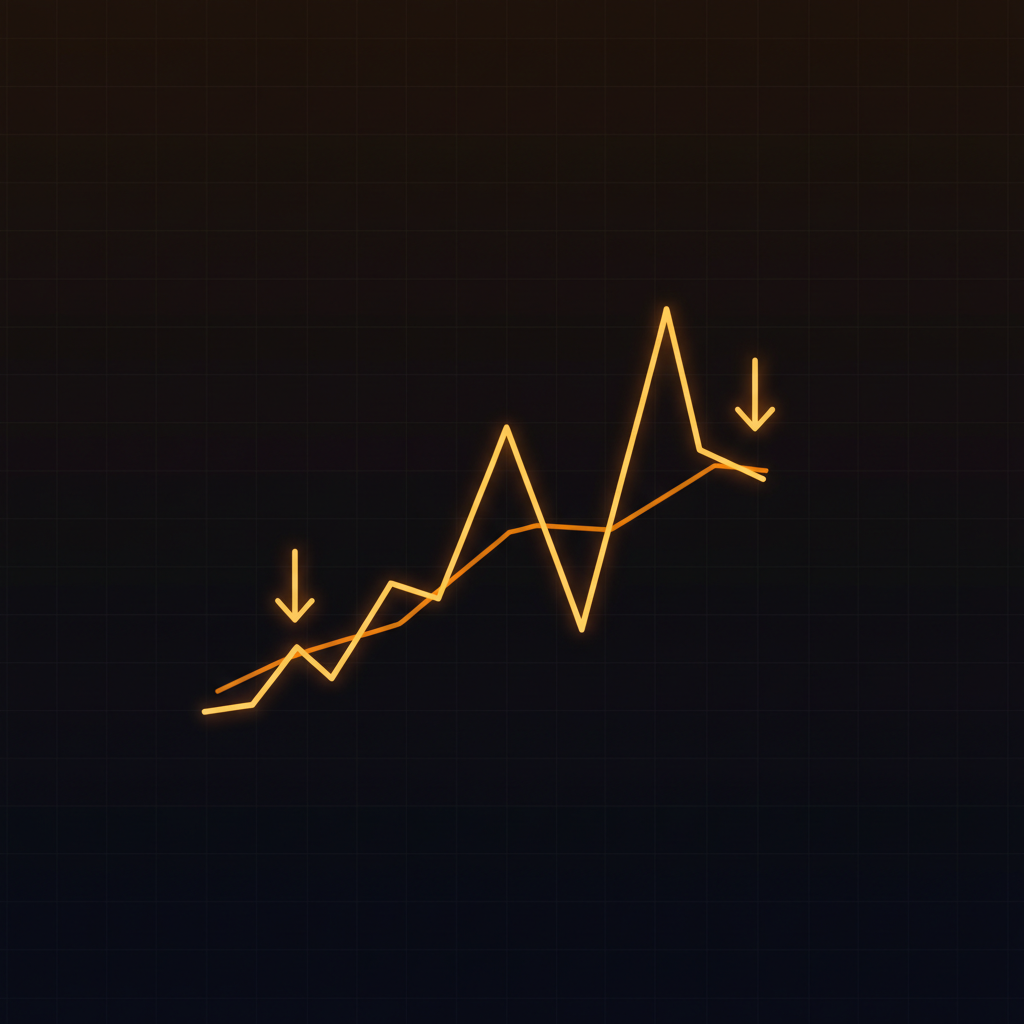
Divergence happens when price and an indicator disagree. Regular divergence warns of a possible reversal — e.g. price makes a higher high but RSI makes a lower high, meaning the rally is weakening underneath. Hidden divergence points to trend continuation. The key rule: divergence is a warning, not a trigger. It tells you a move is tiring — you still wait for confirmation before acting.
Divergence is one of the most useful — and most misused — concepts in technical analysis. Used right, it gives you an early read that a trend is losing strength before the price turns. Used wrong, it convinces traders to short strong uptrends and catch falling knives. This guide teaches both the concept and the discipline to trade it safely.
What is divergence, really?
Think of a ball thrown into the air. It keeps rising for a moment even as its speed drops to zero — and that loss of speed is the warning it's about to fall, before it actually does. Divergence is the same idea on a chart: price (the ball's height) can still be making new highs while momentum (its speed) is already fading. The disagreement is the early warning.
The four types of divergence
Regular Bullish
Price makes a lower low, but the indicator makes a higher low. Selling is losing force — a bottom may be forming.
Regular Bearish
Price makes a higher high, but the indicator makes a lower high. Buying is losing force — a top may be forming.
Hidden Bullish
Price makes a higher low, indicator makes a lower low. The uptrend pullback is healthy — trend likely continues up.
Hidden Bearish
Price makes a lower high, indicator makes a higher high. The downtrend bounce is weak — trend likely continues down.
Simple memory aid: regular divergence is about the trend ending; hidden divergence is about the trend continuing. Both compare price highs/lows to the indicator's highs/lows — you're just looking for them to disagree.
Where to spot divergence: RSI and volume
RSI divergence (momentum)
RSI is the classic divergence tool. Compare the peaks (or troughs) of price to the peaks (or troughs) of RSI. When they disagree, momentum is diverging from price — the move is losing its engine even if price hasn't turned yet.
Volume divergence (conviction)
When price makes new highs but volume shrinks on each push, the move is running on fumes — fewer participants are willing to chase it. Volume divergence is a powerful confirmation that a trend is thinning out, especially alongside RSI divergence.
The danger: divergence is early, and early can be wrong
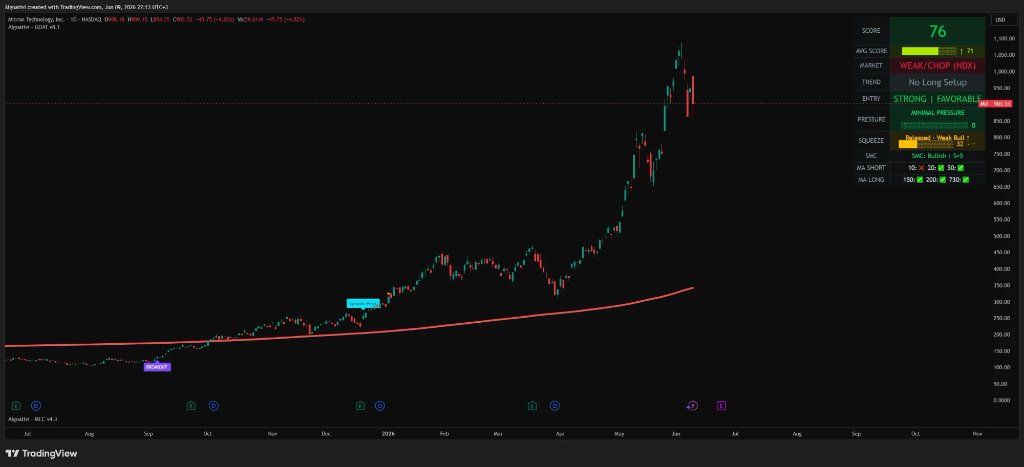
Here's the trap that catches almost everyone: divergence tells you a move is weakening, not that it's over. A strong uptrend can show bearish RSI divergence for days — even weeks — while still grinding higher and stopping out every trader who shorted "the divergence." Knowing whether momentum is genuinely rolling over versus just pausing is the hard, judgment-heavy part.
🧠 Neural Engine — momentum staged, not guessed
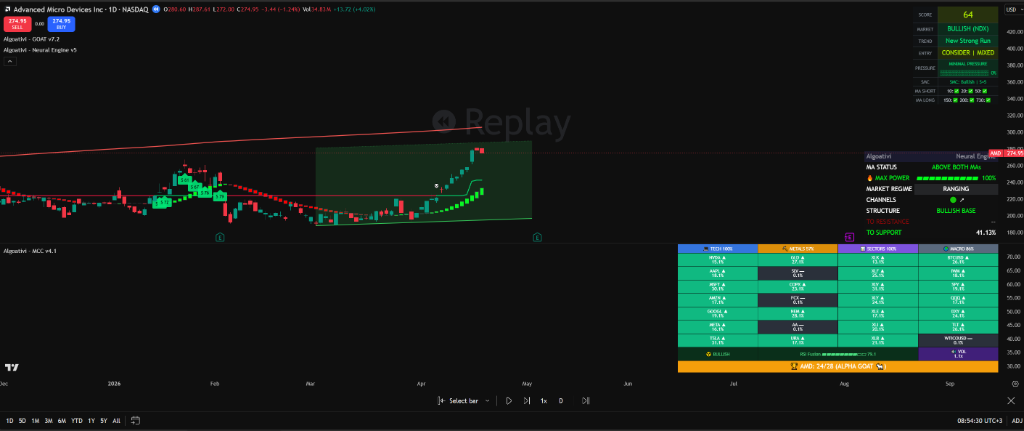
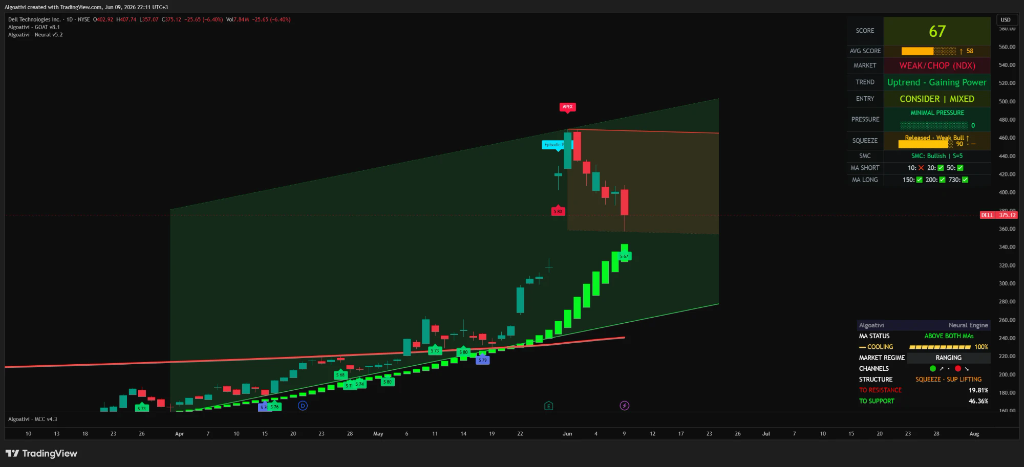
This is where the Neural Engine earns its place. Instead of leaving you to eyeball whether momentum is fading, it breaks every bar's momentum into a 10-stage power classification — from building to peaking to cooling to flipping — so you can see which stage of strength a move is actually in. Divergence plus a momentum stage that's clearly cooling is a far more honest read than divergence alone.
It's one layer of a suite that reads 250+ technical-analysis evidence points per bar across 8 scoring engines into one 0–100 Score. The Score quietly factors momentum in — so a fading move shows up in the number, and you decide what to do with it.
How to trade divergence safely
Spot the disagreement
Identify clear divergence between price swings and RSI (or volume). Vague, forced divergence doesn't count.
Check the trend context
Regular divergence works best at the end of an extended move into a key level — not in the middle of a fresh, strong trend.
Wait for confirmation
Never trade the divergence itself. Wait for price to confirm — a break of structure, a reversal candle, momentum clearly rolling over.
Define risk beyond the extreme
Your stop sits beyond the price high/low that formed the divergence. If price exceeds it, the divergence failed — get out.
Decide with the full picture
Divergence plus a cooling momentum stage, at a key level, with confirmation = a real setup. Anything less is a guess. You make the call.
4 common divergence mistakes
Trading divergence as a trigger. It's a warning, not an entry. Shorting strong trends on divergence alone is account suicide.
Forcing it. If you have to squint to see the divergence, it isn't there. Demand clear, obvious disagreement.
Ignoring the trend. Regular divergence against a powerful trend usually fails. Respect the bigger picture.
Skipping confirmation. "Momentum is fading" and "price has turned" are different. Wait for the second one.
Frequently asked questions
QWhat is divergence in trading?
Divergence is when price and an indicator (like RSI or volume) move in opposite directions. For example, price makes a higher high while RSI makes a lower high. It signals that the momentum behind a move is weakening — an early warning that the trend may be tiring, though not necessarily reversing yet.
QWhat's the difference between regular and hidden divergence?
Regular divergence warns of a potential reversal (the trend may be ending). Hidden divergence signals continuation (the trend is likely to resume after a pullback). Regular = trend ending; hidden = trend continuing. Both compare price swings to indicator swings.
QIs RSI or volume better for spotting divergence?
RSI is the most common and reliable for momentum divergence. Volume divergence (new price highs on shrinking volume) is excellent confirmation. The strongest signals appear when both agree — momentum and participation are fading at the same time.
QWhy does divergence fail so often?
Because traders treat it as a trigger instead of a warning. Divergence can persist for a long time in strong trends — a move can keep going while momentum quietly fades. It should only be acted on with trend context and price confirmation, never on its own.
QHow do I know if momentum is actually rolling over?
Look at the stage of momentum, not just one reading. Algoat.TV's Neural Engine classifies momentum into 10 stages — building, surging, cooling, flipping — so you can tell whether a move is genuinely rolling over or just pausing, which makes divergence far more trustworthy.
See which stage your momentum is really in.
10-stage momentum, weighed into one 0-100 Score. Stop shorting strong trends on a hunch. Free for 7 days.
🚀 Start Your 7-Day Free TrialDisclaimer: This article is educational and not financial advice. Algoat.TV indicators are quantitative analysis tools — they do not provide trade signals, recommendations, or guaranteed outcomes. Trading involves risk of loss. Always do your own research and trade your own plan.