The Parabolic Short: How to Trade Exhaustion Reversals Safely
Think of a stock like a rubber band. Stretch it a little and it holds. Stretch it too far, too fast, and it snaps back hard. The parabolic short is the trade that captures that snap-back, and it is the third of the three timeless momentum setups. Be warned up front: this is by far the riskiest of the three if you do it wrong or you cannot obey a stop. Trade it with respect, or do not trade it at all.
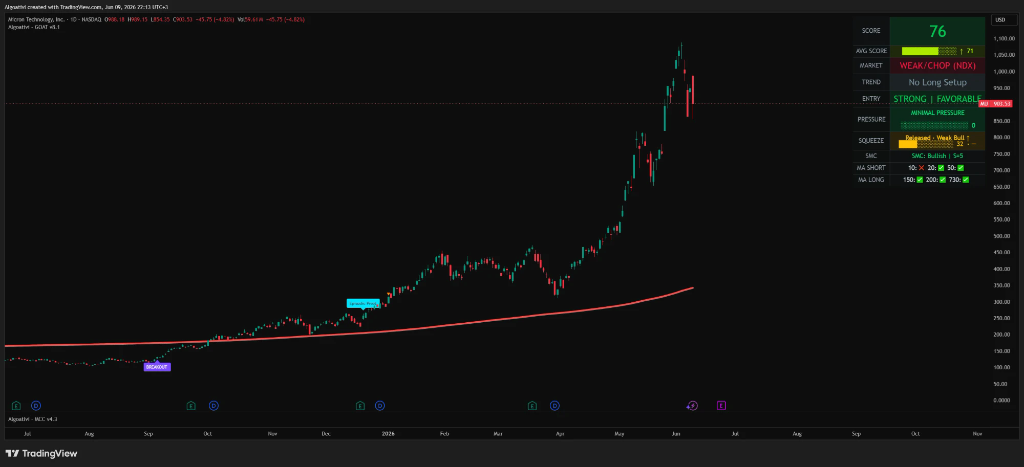
A parabolic short fades an overextended stock, one up 50 to 100%+ (or 300 to 1000% for small caps) in a few days and several days up in a row, betting on a sharp snap-back toward its moving averages once the last buyer has bought. You enter on a defined failure (a VWAP fail is cleanest), keep a tight stop, and target the 10/20-day MA.
The premise: rubber bands snap back
When a stock goes vertical, the move feeds on itself: momentum chasers, short squeezes, FOMO. But price cannot outrun gravity forever. Once the last buyer has bought, there is no one left to lift it, and the snap-back toward the mean (the moving averages) is fast and violent.
This is not new. Livermore wrote about the exhaustion at the end of a move. Wyckoff mapped the "buying climax" that marks distribution, smart money selling into the frenzy. The parabolic reversal is that climax, made tradeable.
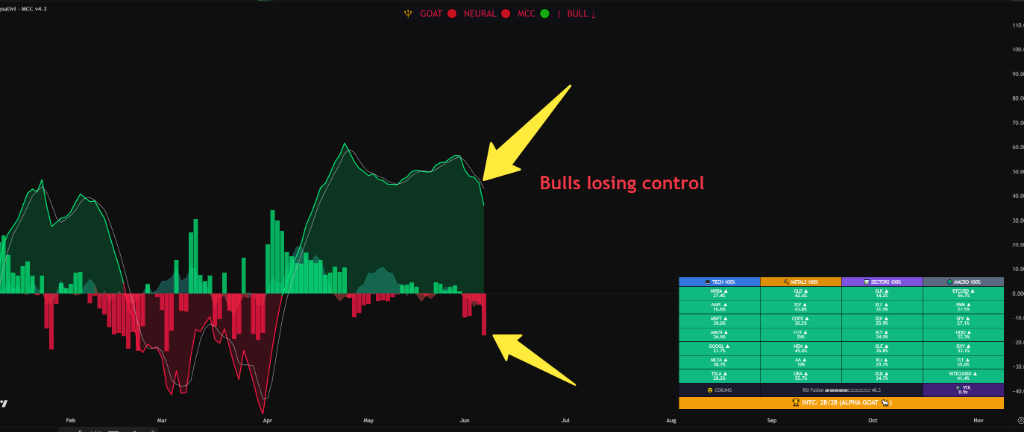
The two criteria that qualify a candidate
A stock qualifies as a parabolic short candidate when both of these are true. Miss either one and you are not looking at the setup, you are just calling a top.
Extreme, fast extension
The stock is up roughly 50 to 100%+ in a few days or weeks if it is a larger cap, or 300 to 1000%+ if it is a smaller cap. The move is clearly unsustainable, a near-vertical run, not a healthy trend.
Consecutive up days
The stock is up 3 to 5+ days in a row. Many of the best candidates trend higher for weeks or months and then accelerate, the slope steepening into a blow-off. Some simply explode from nowhere. The acceleration is the tell that the rubber band is at full stretch.
The entry triggers (and why timing is everything)
This is where discipline separates traders who make money on this setup from those who get destroyed. You are fading strength, so your timing has to be precise. There are a few low-risk entry triggers, each built around one idea: you never short "because it is high." You short a specific failure with a specific, small risk.
Opening range low (ORL) break
Short a break below the low of the first 1- or 5-minute candle. The opening range gives you a defined level, so your risk is the distance back to the high of that range.
First red 5-minute candle
If the stock rips straight up from the open, wait for the first 5-minute candle to close red rather than picking a top. The first red candle is the first crack in the buying.
The VWAP fail (the cleanest)
Let the stock have its first crack lower, then bounce back up into VWAP, the volume-weighted average price, the one intraday indicator that matters most here. If it fails at VWAP (for example, the first red 1- or 5-minute candle rolling over right at VWAP), that is your entry, or your spot to add.
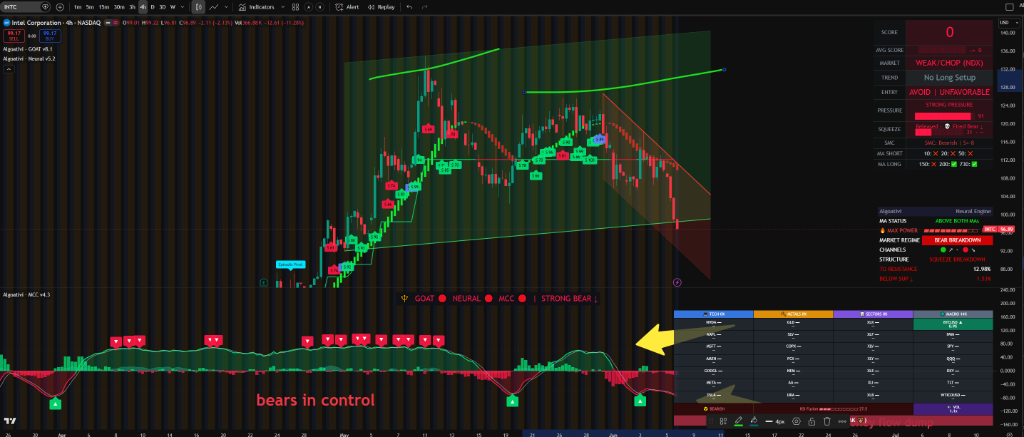
Parabolic short entry triggers compared
The cleaner the trigger, the more you give the amateur shorts time to get run over first, and the tighter your defined risk. Here is how the three stack up.
| Trigger | How it works | Stop | Cleanliness |
|---|---|---|---|
| Opening range low (ORL) break | Short a break below the low of the first 1- or 5-min candle. | High of the opening range / high of day. | Good |
| First red 5-min candle | Wait for the first 5-min candle to close red instead of picking a top. | High of the day. | Better |
| VWAP fail | Let it crack lower, bounce back into VWAP, then short the failure (first red candle rolling over at VWAP). | A reclaim of VWAP, your premise is wrong. | Cleanest |
Where the stop and target go
The stop
Stop at the high of the day, or on a VWAP-fail entry, a reclaim of VWAP is your stop. If price takes VWAP back, your premise is wrong, get out. The reason for the obsession with tight stops: parabolic moves can have one more violent leg up before they break. A wide stop on a vertical stock is how accounts blow up.
The target
The target area is the 10- and 20-day moving averages, where these overextended stocks tend to snap back to and bounce. You are capturing the move from the stretched extreme back toward the mean, not trying to ride it to zero.
Risk and reward, set expectations
The parabolic short is not the breakout or the episodic pivot. Those can hand you 30 to 50x+ on your risk if you select well. This setup is more like a 5 to 10x risk/reward, still excellent, but smaller. The trade-off is that if you wait only for the cleanest setups, your accuracy tends to be higher.
The discipline that defines this setup
One rule matters more than any other: do not be early. Most traders who lose on parabolic shorts lose because they try to pick the top while the stock is still going vertical.
The move: wait for the right setup, and let the amateur shorts get run over first. Their stop-outs are fuel for the final squeeze, and the failure of that final squeeze is your edge. Patience is not a virtue here; it is the entire strategy.
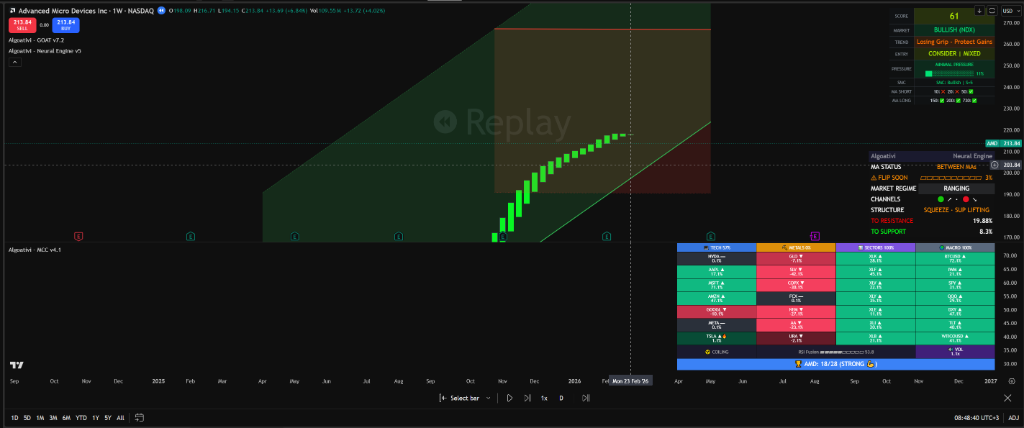
The parabolic long variant
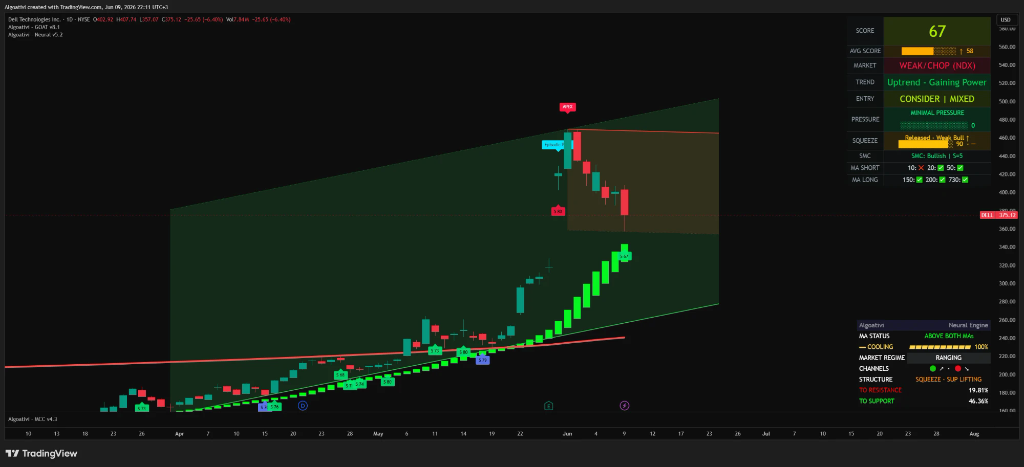
These do not appear often, but they are worth knowing. Any time a successful parabolic short collapses 50 to 60%+ in a few days, that crash sets up the long. The stock is now as overstretched to the downside as it was to the upside.
- Entry: opening range high, the first green 5-minute candle, or any clean range break to the upside.
- The snap-back: these can bounce 50 to 100% in a few days.
Same rubber-band logic, opposite direction.
- Shorting too early. The cardinal sin. Vertical can get more vertical. Wait for the failure.
- No defined stop. Fading a parabola without a tight stop is how you get carried out.
- Sizing like it is a breakout. This is the riskiest setup; size accordingly.
- Fighting it with no trigger. "It is up 80%, it has to drop" is not a setup. The ORL break, the first red candle, or the VWAP fail is.
- Overstaying. The target is the 10/20-day MA, not zero. Take the snap-back and go.
How Algoat.TV reads this setup
Exhaustion is emotional to trade. You are standing in front of a freight train, waiting for the exact moment it runs out of track. Objective math helps you wait. The Algoat.TV indicators give you that reading, never an instruction:
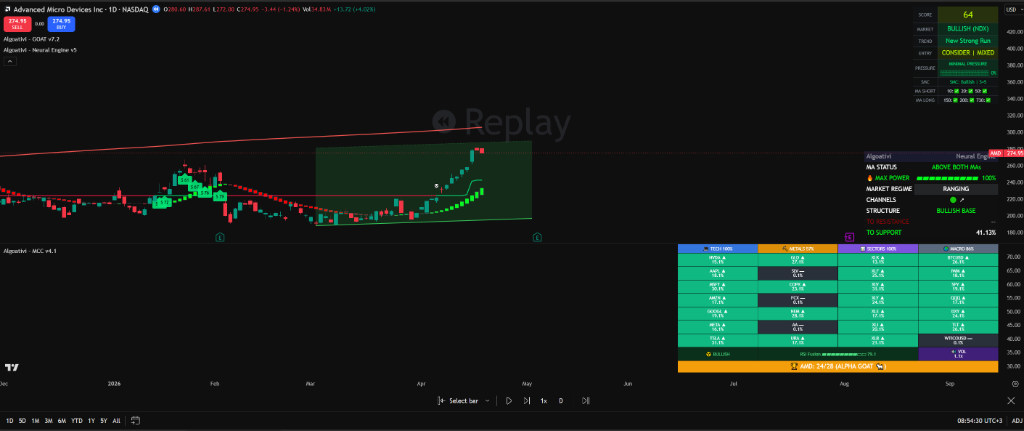
- The G.O.A.T. (General Overlay Analysis Toolkit) flags parabolic and over-extension conditions (its Apex and "losing grip" logic) and the loss of momentum that precedes the snap-back, scored into a 0-100 reading so the stretch is measured, not guessed.
- The suite tracks VWAP and the 10/20-day moving averages, your entry reference and your target, computed live across 250+ technical calculations per bar.
- The Trinity Convergence Wave fuses the G.O.A.T., Neural Engine, and Macro Command Center (MCC) into one verdict and prints conviction-turn markers and FADING tags at exactly the moments momentum rolls over at an extreme, the structural moment this setup is built on.
The tools tell you where the math sits. Whether to take the trade, and how much to risk, is always your call. You stay in the driver's seat. For a second opinion, take a screenshot of your TradingView chart and paste it into the AI Quant, Powered by Anthropic Claude, a separate layer that reads the indicators and gives you a second math reading in any language.
Start your free 7-day trial, no card →
Full GOAT Membership · No card required · 30-day money-back if you stay.
Frequently asked questions
What is a parabolic short?
When do you enter a parabolic short?
What's the target on a parabolic short?
Why is the parabolic short considered risky?
See your charts read this way
The setups are timeless. The edge is seeing the stretch measured, before the snap-back, instead of guessing the top.
Start your free 7-day trial →