Volume Profile & VWAP on TradingView: Complete Guide (2026)
Where the real money traded, and what it means for your next move. Two volume tools every serious trader should understand — explained from zero.
Volume Profile shows you where the most trading happened by price (not by time) — revealing the levels that act as magnets and walls. VWAP shows the volume-weighted average price, the fair-value line institutions benchmark against. Anchored VWAP lets you start that line from any key event. Together they answer one question price alone can't: where does the real money actually care about price?
Most indicators are built on price and time. Volume tools are different — they're built on participation. And participation is where the truth hides. A level only matters if real money defended it. A breakout only counts if real money pushed it. Volume Profile and VWAP are how you see that, and this guide teaches both from scratch.
What is Volume Profile? (the simple version)
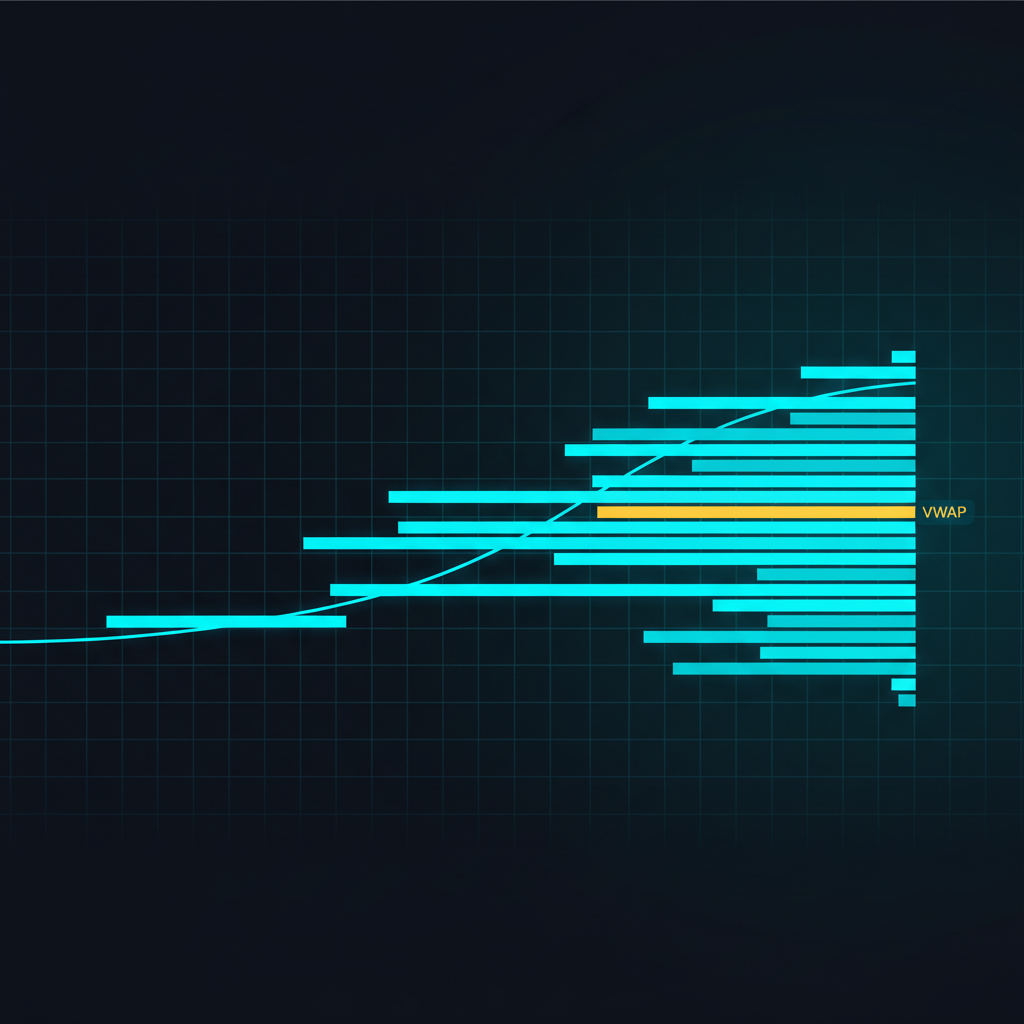
Picture turning the volume histogram on its side so it runs vertically, along price instead of time. Now each horizontal bar shows how much volume changed hands at that exact price level. Fat bars = prices the market spent a lot of energy at. Thin bars = prices it raced through.
The price with the most volume — the fattest bar. It acts like a magnet: price often returns to it. The most important line on the profile.
The price range where ~70% of volume traded (VAH = high, VAL = low). This is where the market agreed on "fair." Edges often act as support/resistance.
A thick zone of heavy trading. Price tends to slow and consolidate here — lots of participants to absorb moves.
A thin zone the market raced through. Price tends to move fast across these — few orders to slow it down. Great for targets.
The plain-English takeaway: price moves quickly through low-volume gaps and gets sticky inside high-volume zones. Knowing where those zones are tells you where moves accelerate and where they stall.
The two volume tools, and how to use each
Volume Profile — the map
Use Volume Profile to find your key levels before the session. The POC and value-area edges are your reference points. Price returning to the POC is a classic mean-reversion play; price rejecting a value-area edge is a classic fade.
VWAP — the live fair-value line
VWAP = the average price weighted by volume. Because big institutions measure their fills against it, it becomes a self-fulfilling reference. Above VWAP, buyers are paying up; below it, sellers are pressing. Pullbacks to VWAP in a trend are textbook continuation spots.
Anchored VWAP — fair value from an event
Regular VWAP starts at the open. Anchored VWAP lets you start it from any candle you choose — an earnings gap, a swing high, a major news bar. Now the line shows the average price of everyone who's traded since that event. Incredibly powerful for reading who's in profit and where defenders sit.
The hard part: anchoring it correctly, every time
Here's the honest friction with anchored VWAP: choosing where to anchor is a judgment call, and you have to redo it every time the trend resets. Anchor too early or too late and the line lies to you. Doing this manually, on every chart, all day, is exactly the kind of repetitive work that quietly erodes a trader's focus.
🐐 Smart Anchored VWAP, done for you
The G.O.A.T. Toolkit on Algoat.TV includes a Smart Anchored VWAP that re-anchors itself automatically on each new Strong Start or confirmed Breakout — so the line always reflects the current move, not a stale one you forgot to reset. It's one of 250+ technical-analysis evidence points the suite evaluates on every bar, feeding the single 0–100 Score alongside trend, momentum, volume and Smart Money structure.
You get the institutional fair-value read without babysitting the anchor — the math handles it, you make the call.
A simple volume-based workflow
Mark the map
Add a Volume Profile. Note the POC and the value-area edges (VAH/VAL). These are your reaction zones for the session.
Add the fair-value line
Drop VWAP for the intraday read. For swing context, anchor a VWAP to the last major pivot or catalyst.
Read the relationship
Price above VWAP and holding above the POC? Bullish control. Below both? Bearish. Trapped between? Range — fade the edges.
Target the gaps
Low-volume nodes are where price travels fastest. Use them as logical targets and the value-area edges as decision points.
Confirm, then decide
Volume context plus trend and momentum agreeing = confluence. When they don't agree, stand aside. You decide — the levels just sharpen the read.
4 common volume-tool mistakes
Using the wrong profile range. A session profile and a weekly profile give different POCs. Match the range to your timeframe.
Treating VWAP like a daily/weekly tool. Standard VWAP resets each session. For longer context, you must anchor it.
Anchoring VWAP to a random bar. The anchor must be a meaningful event — a gap, pivot, or catalyst — or the line is noise.
Forcing trades inside high-volume nodes. Price chops in HVNs. Save your conviction entries for breaks through low-volume gaps.
Frequently asked questions
QWhat's the difference between Volume Profile and VWAP?
Volume Profile is a static map of where volume traded across price levels (POC, value area, nodes). VWAP is a moving line showing the volume-weighted average price over time. One shows you the terrain; the other shows you the current fair-value level walking across it.
QWhat is the Point of Control (POC)?
The price level with the highest traded volume in your chosen range — the fattest bar on the profile. It acts as a magnet: price frequently returns to test it, which makes it a key reference for mean-reversion setups.
QWhat is anchored VWAP and when should I use it?
Anchored VWAP is a VWAP you start from a specific candle of your choosing — an earnings gap, a major swing, a news event — instead of the session open. Use it to track the average price (and therefore the profit/loss) of everyone who's traded since that event. It's excellent for swing trading and reading institutional levels.
QIs VWAP good for day trading?
Yes — standard VWAP is one of the most-used intraday tools because it resets daily and tracks the session's fair value. Day traders watch whether price holds above or below it and look for entries on the first pullback to the line in a trend.
QCan a tool anchor VWAP for me automatically?
Yes. Algoat.TV's G.O.A.T. Toolkit includes a Smart Anchored VWAP that re-anchors automatically on each new Strong Start or confirmed Breakout, so the line always reflects the current move. It's one of the 250+ evidence points the suite reads on every bar to build its 0–100 Score.
See where the real money cares — automatically.
Smart Anchored VWAP, volume context, and 250+ more readings in one 0-100 Score. Free for 7 days.
🚀 Start Your 7-Day Free TrialDisclaimer: This article is educational and not financial advice. Algoat.TV indicators are quantitative analysis tools — they do not provide trade signals, recommendations, or guaranteed outcomes. Trading involves risk of loss. Always do your own research and trade your own plan.