Support and Resistance: How to Trade Key Levels on TradingView
The most important concept in all of technical analysis — and the one most traders draw wrong. Here's how levels really work, and how to trade them.
Support is a price level where buying tends to overpower selling, so price stops falling. Resistance is where selling overpowers buying, so price stops rising. They work because traders remember those levels and place orders there. The two ways to trade them: the bounce (price rejects the level) and the break (price slices through, then often retests it from the other side).
If you understand support and resistance, you understand 80% of chart reading. Trendlines, channels, order blocks, supply/demand zones, even moving averages — they're all variations on the same idea: some price levels matter more than others, because that's where decisions cluster. This guide teaches the concept properly, then shows you how to act on it.
Why do these levels actually work?
A level becomes "support" because three groups of traders all act there at once. The ones who bought at that price and want to add. The ones who missed the bounce last time and are waiting for a second chance. And the ones who sold and want to buy back at break-even. Their orders stack up at the same price — and that wall of buying stops the fall.
Flip every word and you get resistance. The more times a level is tested and holds, the more traders remember it, the stronger it gets — until it breaks, and then it often flips role entirely.
The three kinds of support & resistance
Horizontal levels
Flat lines at obvious highs and lows. The cleanest, most-watched kind. Round numbers count too.
Dynamic (diagonal)
Trendlines and moving averages that rise or fall with price. Support that moves with the trend.
Role reversal (flip)
Broken resistance becomes support, and vice-versa. The single most reliable S/R pattern there is.
The two ways to trade a level
The Bounce (reversal at the level)
Price approaches a known level and stalls. You wait for evidence of rejection — a wick, a reversal candle, a momentum stall — then trade back toward the middle of the range. The level itself defines your risk: your stop sits just beyond it.
The Break & Retest (continuation)
Price breaks a level with conviction (ideally on rising volume), then pulls back to retest it from the other side. If the old resistance now acts as support, that's your highest-probability entry — the role reversal in action.
The real problem: drawing them is subjective
Here's the honest truth about support and resistance: everyone agrees it matters, and almost nobody draws it the same way. Do you use wicks or closes? The exact high, or a zone? Which timeframe? It's a skill that takes years to do consistently — and even then, it's part art. That subjectivity is where most of the second-guessing in trading lives.
🧠 Neural Engine — levels drawn by math, not mood
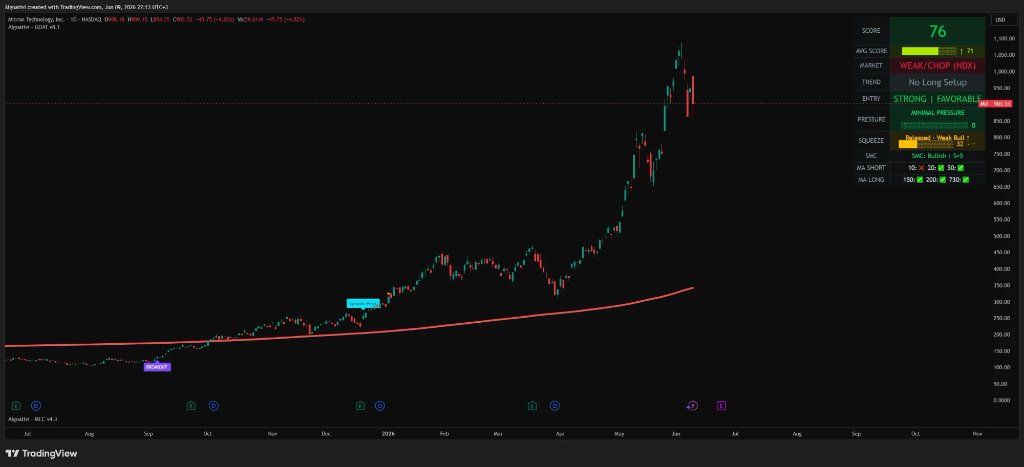
This is exactly why the Neural Engine on Algoat.TV computes the most-respected support and resistance lines for you instead of leaving you to eyeball them. It auto-detects trendlines across Micro, Mid, and Macro ranges, scores each one by how reliably price has respected it, and shows you the strongest — no manual drawing, no bias.
It's one layer of a suite that reads 250+ technical-analysis evidence points on every bar across 8 scoring engines, distilled into a single 0–100 Score. The levels stop being a debate. You just read them — and decide.
A simple support & resistance workflow
Zoom out first
Mark the big, obvious levels on the higher timeframe. These matter most. Everything intraday happens inside them.
Mark zones, not lines
Treat levels as small zones, not pixel-perfect lines. Price respects areas, not exact prices.
Wait for the reaction
Let price reach the level and show you a bounce or a break. Reaction first, decision second.
Confirm with confluence
A level lines up with a moving average, VWAP, or a high-volume node? That's a stronger level. Stack the evidence.
Define risk at the level
Your stop belongs just beyond the level. If it breaks cleanly, your idea was wrong — accept it and move on.
4 common support & resistance mistakes
Drawing too many lines. If your chart looks like a spider web, none of the levels mean anything. Keep the few that matter.
Treating levels as exact prices. They're zones. Demanding a tick-perfect touch gets you faked out constantly.
Trading the bounce before it bounces. Wait for rejection. Anticipating a hold is gambling, not trading.
Ignoring the higher timeframe. A daily level crushes a 5-minute level. Know which one you're standing on.
Frequently asked questions
QWhat is the difference between support and resistance?
Support is a price floor — a level where buyers tend to step in and stop price from falling. Resistance is a price ceiling — where sellers tend to step in and stop price from rising. When a support level breaks, it often becomes resistance, and vice-versa (role reversal).
QWhat is the best support and resistance indicator?
The most useful ones auto-detect and score levels objectively rather than leaving it to your eye. Algoat.TV's Neural Engine, for example, computes the most-respected trendlines across three ranges and ranks them by reliability — removing the subjectivity that makes manual S/R so inconsistent.
QHow do I know if a level will hold or break?
You don't — you wait for price to show you. A bounce shows rejection (wicks, reversal candles, stalling momentum). A break shows conviction (a decisive close through on rising volume). Trade the reaction, not the prediction, and let the level define your stop.
QShould support and resistance be lines or zones?
Zones. Price rarely respects an exact tick — it reacts to an area. Drawing a small zone instead of a pixel-perfect line keeps you from getting shaken out by minor overshoots.
QDo moving averages act as support and resistance?
Yes — popular moving averages (like the 50 and 200) often act as dynamic, diagonal support and resistance because so many traders watch them. They're a form of moving S/R that travels with the trend.
Stop guessing where the levels are.
Let the Neural Engine compute and score them for you — inside one 0-100 read. Free for 7 days.
🚀 Start Your 7-Day Free TrialDisclaimer: This article is educational and not financial advice. Algoat.TV indicators are quantitative analysis tools — they do not provide trade signals, recommendations, or guaranteed outcomes. Trading involves risk of loss. Always do your own research and trade your own plan.