Smart Money Concepts Explained — The Complete 2026 Guide
You're using RSI and MACD because someone told you to. Because a YouTube video from 2019 said "when the lines cross, buy."
Meanwhile, the institutions that actually move the market are leaving footprints everywhere.
And you're stepping right over them.
This guide teaches you to read those footprints.
Smart Money Concepts (SMC) is a price action framework that identifies the structural footprints left by institutional traders — banks, hedge funds, and market makers — as they build and unload large positions. Instead of relying on lagging indicators like RSI or MACD, SMC reads the market's structure directly through four core concepts: Order Blocks (institutional entry zones), Fair Value Gaps (price imbalances that tend to get filled), Break of Structure (trend continuation signals), and Change of Character (reversal warnings). Together, they form a complete framework for understanding why price moves, not just that it moved.
IN THIS GUIDE
What Are Smart Money Concepts?
Traditional technical analysis treats the market as a democracy. Every buyer and every seller has the same weight. RSI doesn't care if the volume came from a retail trader buying 10 shares or a pension fund accumulating a $200 million position across three weeks.
But the market is not a democracy. It's a hierarchy. Roughly 80% of daily volume in U.S. equity markets comes from institutional players — banks, hedge funds, pension funds, and market makers. These entities don't buy and sell in one click the way you do. They can't. Their positions are too large.
A hedge fund that wants to buy $50 million worth of AAPL can't drop a single market order. That order would eat through the entire order book, spiking the price against itself. Instead, it accumulates — buying in pieces, across time, at specific price levels, using algorithms designed to minimize market impact.
This accumulation process — and the distribution process when they unload — leaves structural footprints on the chart. Footprints that look nothing like what RSI or MACD measures. But footprints that are visible, repeatable, and tradeable.
THE CORE INSIGHT
Smart Money Concepts is the framework for reading those footprints. It doesn't predict the future — it identifies what institutions have already done and positions you alongside them, not against them. The four pillars — Order Blocks, Fair Value Gaps, Break of Structure, and Change of Character — each describe a different type of footprint. Together, they tell you where institutions entered, where imbalances exist, and when the trend is confirming or reversing.
Retail TA vs. Smart Money Concepts
The difference is fundamental. Traditional indicators are derivatives of price — they take historical price data, run a formula, and produce a number. RSI compresses 14 candles into a 0–100 value. MACD subtracts one average from another. They tell you what already happened, packaged in a different format.
SMC reads the structure of price itself. It looks at how candles form relative to each other, where swing points break, where gaps appear, and where price leaves unfinished business. There's no formula. There's no oscillator. There's pattern recognition rooted in market microstructure — the mechanics of how large orders interact with the order book.
Traditional TA (Lagging)
• RSI tells you overbought/oversold after the move
• MACD crosses confirm a trend that already started
• Bollinger Bands react to volatility, they don't explain it
• Treats all volume as equal
SMC (Structural)
• Order Blocks show where institutions entered
• FVGs reveal price imbalances that need filling
• BOS/CHoCH define trend state in real-time
• Distinguishes institutional flow from retail noise
This doesn't mean RSI and MACD are useless. They're confirmation tools. But they should never be your primary framework. Structure first. Indicators second. That's the SMC hierarchy.
Order Blocks Explained
An Order Block is the last opposite-color candle before a strong impulsive move. It marks the zone where institutional traders placed the orders that caused that move. And because those institutions didn't fill their entire position in one candle, the zone becomes a magnet for price to return to — where the remaining orders are waiting.
Think of it like a loading dock. A truck pulls up, loads 60% of the cargo, and leaves. The rest of the cargo is still sitting on the dock. When the truck comes back, it returns to the same loading dock — not a random spot in the parking lot. Order Blocks are loading docks for institutional positions.
How to Identify an Order Block
Find the impulsive move
Look for a strong, aggressive candle (or series of candles) that breaks structure — a big green push that takes out a recent high, or a big red drop that breaks a low. This move should be decisive, not a slow drift.
Look back at the last opposite-color candle
Before a bullish impulse, find the last bearish (red) candle. Before a bearish impulse, find the last bullish (green) candle. That candle — specifically its entire body range from open to close — is the Order Block.
Mark the zone
Draw a rectangle from the open to the close of that candle (some traders include the wick for a wider zone). This is your Order Block — a high-probability zone where price may react when it returns.
Bullish vs. Bearish Order Blocks
▲ Bullish Order Block
The last red candle before a strong bullish impulse. This is where institutional buyers absorbed selling pressure and began accumulating longs.
How to trade it: When price retraces back to this zone, look for bullish confirmation (rejection wicks, BOS on a lower timeframe) and enter long. Your stop goes below the Order Block.
▼ Bearish Order Block
The last green candle before a strong bearish impulse. This is where institutions finished distributing longs and initiated shorts.
How to trade it: When price rallies back into this zone, look for bearish confirmation (rejection wicks, BOS to the downside on LTF) and enter short. Your stop goes above the Order Block.
Why Price Returns to Order Blocks
This isn't magic. It's market mechanics. When a large institution enters a position, they rarely fill 100% at one price. They get a partial fill, the price moves in their favor due to the demand they created, and they still have unfilled orders sitting at the original level.
These resting orders act as support or resistance when price returns. The institution wants to buy more at the same price. Their resting bids absorb selling pressure, causing price to bounce. That's why Order Blocks work — there's literal demand (or supply) sitting at that level.
⚠ COMMON MISTAKE: TRADING EVERY ORDER BLOCK
Not every last opposite-color candle is a valid Order Block. The impulsive move that follows must be strong enough to break structure — otherwise it's just normal price action. An Order Block that doesn't lead to a Break of Structure is just a candle. Additionally, Order Blocks that have already been tested 2–3 times lose their potency — the resting orders have likely been filled.
Fair Value Gaps (FVGs) Explained
A Fair Value Gap is a three-candle pattern where the wick of the first candle and the wick of the third candle don't overlap — leaving a gap in price that only the middle candle traded through. This gap represents an imbalance: price moved so fast that there wasn't two-sided trading at those levels.
Markets tend to be efficient over time. When price skips through a zone without proper auction (buyers and sellers meeting at each level), the market treats that zone as "unfair" — it hasn't been properly valued. So price tends to retrace back to fill that gap before continuing.
Historical data suggests approximately 60–70% of Fair Value Gaps get at least partially filled. That's not a guarantee — it's an edge. And an edge is all you need when combined with proper structure analysis.
The 3-Candle Pattern
Bullish vs. Bearish FVGs
▲ Bullish FVG
Forms during a strong upward impulse. The gap sits between Candle 1's high and Candle 3's low. Price left buyers behind — it moved up so fast that not everyone who wanted to buy got filled.
Trade it: When price dips back into the gap, those unfilled buyers step in. Enter long when price touches the top of the gap zone (conservative) or the midpoint (standard). Stop below the gap.
▼ Bearish FVG
Forms during a strong downward impulse. The gap sits between Candle 1's low and Candle 3's high. Price dropped so fast it left sellers behind — inefficiency that needs resolving.
Trade it: When price rallies back into the gap, unfilled sell orders kick in. Enter short when price touches the bottom of the gap (conservative) or midpoint (standard). Stop above the gap.
WHY ~70% OF FVGs GET FILLED
Market makers profit from the spread. When price skips through a zone, market makers didn't get to facilitate trades at those levels — they missed their cut. They have a vested interest in price returning to those levels so they can collect fees. Additionally, unfilled limit orders from other participants sit in the gap zone, creating passive demand/supply that pulls price back. It's not a conspiracy. It's market microstructure doing what it's designed to do.
Break of Structure (BOS)
Break of Structure is the SMC equivalent of trend confirmation. It answers a simple question: Is the current trend continuing?
An uptrend is defined by a series of higher highs and higher lows. A BOS occurs when price breaks above the most recent swing high, confirming that the bullish structure is intact. Conversely, in a downtrend (lower highs, lower lows), a BOS occurs when price breaks below the most recent swing low.
The critical word is break. Price needs to close beyond the level, not just wick through it. A wick that pokes above a high and then reverses is a sweep (we'll cover that in the Liquidity section), not a break.
Bullish BOS vs. Bearish BOS
Bullish BOS
• Price makes a higher low (pullback held above previous low)
• Price then pushes up and closes above the most recent swing high
• The uptrend is confirmed — structure is intact, buyers are in control
Bearish BOS
• Price makes a lower high (rally failed below previous high)
• Price then drops and closes below the most recent swing low
• The downtrend is confirmed — structure is bearish, sellers are in control
BOS is your green light. It tells you the trend is doing what it's supposed to do. When you see a BOS, you're looking for pullbacks to Order Blocks or FVGs to enter in the direction of the break. You're not predicting — you're confirming and joining.
Why BOS matters for your entries: An Order Block is only tradeable when it's in the direction of structure. A bullish OB in a bearish structure is dangerous — you're catching a bounce in a falling market. But a bullish OB after a bullish BOS? Now you have alignment. Structure confirmed the direction. The OB gives you the level. The combination gives you the trade.
Change of Character (CHoCH)
If BOS is the green light that says "trend is continuing," CHoCH is the amber warning that says "something just changed."
A Change of Character occurs when price breaks a key structural level against the prevailing trend. In an uptrend (higher highs, higher lows), a CHoCH happens when price breaks below the most recent higher low. In a downtrend, it happens when price breaks above the most recent lower high.
The difference between BOS and CHoCH is direction relative to the trend:
The Danger of Premature CHoCH Identification
CHoCH is one of the most over-traded signals in SMC. Here's why: in a strong uptrend, price will occasionally dip below a minor swing low as part of normal retracement. Traders who label every minor breach as a "CHoCH" will get whipsawed constantly — selling right before the trend resumes.
The fix is timeframe alignment. A CHoCH on a 5-minute chart inside a 4-hour uptrend is noise. A CHoCH on the 4-hour chart inside a daily uptrend deserves attention. A CHoCH on the daily inside a weekly uptrend is a serious warning.
⚠ THE CHoCH TRAP
A single CHoCH is not enough to reverse your bias. It's a warning, not a command. The safest play after a CHoCH is to stop trading in the previous direction and wait for a BOS in the new direction to confirm the reversal. CHoCH says "the trend might be over." The follow-up BOS says "the new trend has begun." Trade the confirmation, not the warning.
Liquidity — The Fuel That Drives Price
Liquidity is the concept that ties all of SMC together. Without understanding liquidity, Order Blocks are just zones, FVGs are just gaps, and BOS/CHoCH are just labels. With it, the entire framework clicks into place.
In the SMC context, liquidity refers to clusters of stop-loss orders sitting at predictable levels in the market. These stops represent resting orders — orders that haven't been triggered yet — and they act as fuel for institutional price moves.
Here's the mechanism: when an institution wants to buy a large position, they need sellers. Where are sellers? At stop-loss levels, where existing longs get stopped out and their positions are sold. The institution drives price down to those stops, triggers them (creating a flood of sell orders), and uses that sell-side liquidity to fill their buy orders. Then price reverses sharply. That "stop hunt" you keep experiencing? It's not random. It's liquidity engineering.
Buy-Side vs. Sell-Side Liquidity
Buy-Side Liquidity (BSL)
Sits above swing highs and equal highs. These are the stop-loss orders of short sellers and the breakout buy orders of traders waiting for a push higher.
When price sweeps BSL, it triggers these orders, providing fuel for institutions to sell into (distribute). Sweeping BSL is often the precursor to a reversal lower.
Sell-Side Liquidity (SSL)
Sits below swing lows and equal lows. These are the stop-loss orders of long traders and the breakout sell orders of traders waiting for a break lower.
When price sweeps SSL, it triggers these stops, providing fuel for institutions to buy (accumulate). Sweeping SSL is often the precursor to a reversal higher.
Where Stop Losses Cluster
Retail traders are predictable. They place stops at:
▸ Just below obvious swing lows (long stops)
▸ Just above obvious swing highs (short stops)
▸ Below round numbers ($100, $50, $200)
▸ Below/above trendlines that "everyone" sees
▸ At equal highs and equal lows (double tops/bottoms)
▸ Below/above the 200 MA on obvious timeframes
Liquidity Sweeps
A liquidity sweep is the moment price pushes past a liquidity level, triggers the stops, and then reverses. It's the signature move of institutional trading. On a chart, it looks like a wick that pokes beyond a key level and then snaps back. The longer the wick relative to the body, the more aggressive the sweep.
This is what makes SMC different from traditional breakout trading. Traditional TA says "price broke above resistance — buy." SMC says "price wicked above resistance to grab liquidity — now watch what happens next." Often, the answer is a reversal, because the "breakout" was never about continuation. It was about stop-hunting.
THE LIQUIDITY CYCLE
Institutions need liquidity to enter large positions → Liquidity sits at predictable levels (stops, equal highs/lows) → Price is engineered to those levels to trigger stops → Triggered stops create the opposing orders institutions need → Institutions fill their position → Price reverses. This cycle repeats across all timeframes, all asset classes, and all market conditions. Once you see it, you can't unsee it.
SEE SMC ON YOUR CHART
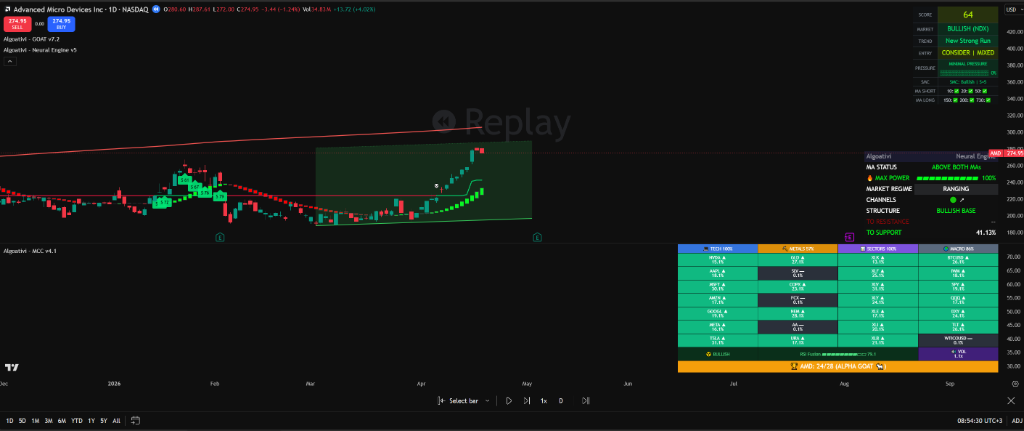
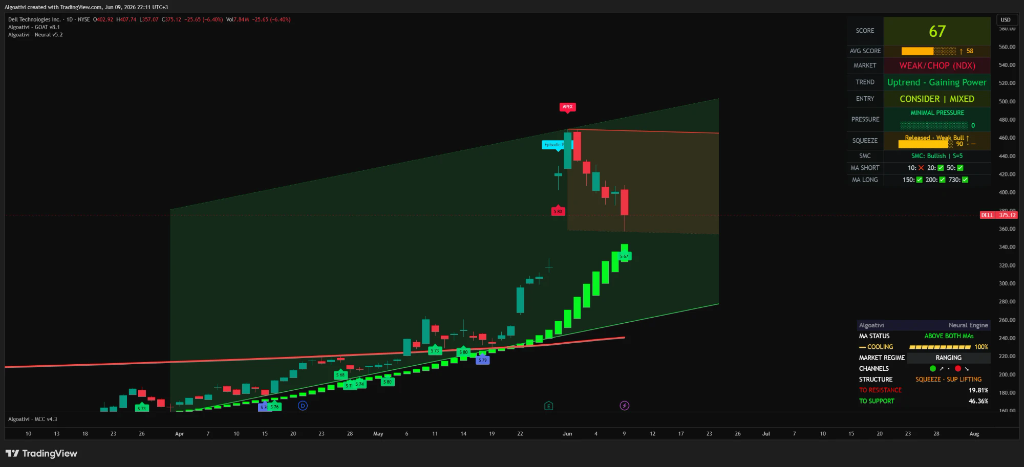
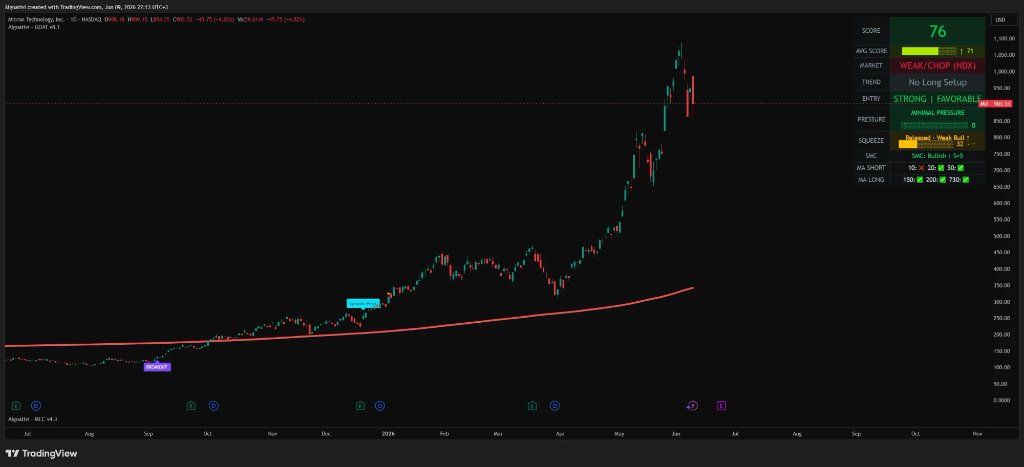
The GOAT Toolkit detects Order Blocks, FVGs, BOS & CHoCH automatically.
No drawing. No guessing. Every pattern, on every timeframe, in real-time. 7-day free trial. No credit card.
See Your Chart's Structure →How to Combine SMC Concepts Into a Trading Framework
Knowing what Order Blocks, FVGs, BOS, CHoCH, and Liquidity are is step one. Knowing how they fit together into a repeatable process is the difference between theory and execution.
Here's the step-by-step framework — the exact sequence professional SMC traders follow before placing a trade:
Identify Higher-Timeframe Structure
Start on the daily or 4-hour chart. Determine the prevailing structure: is price making higher highs/higher lows (bullish) or lower highs/lower lows (bearish)? Has a BOS confirmed the trend, or has a CHoCH warned of a shift? This is your directional bias. You only take trades in this direction.
Locate Liquidity Targets
Mark the obvious liquidity levels: equal highs, equal lows, swing highs that haven't been broken, trendline stops. These are the magnets. Price is heading toward one of these targets. In a bullish structure, price is likely targeting buy-side liquidity above. In bearish, sell-side below.
Wait for a Liquidity Sweep
Don't enter on the first touch. Wait for price to sweep the liquidity level — take out the stops — and then show a reaction. A sweep followed by immediate reversal is the setup. This is where most retail traders get stopped out and where institutional orders get filled.
Enter at the Order Block or FVG
After the sweep, drop to your execution timeframe (1H or 15M). Look for a CHoCH on this lower timeframe confirming the reversal, then enter at the nearest Order Block or FVG. Your entry is precise because you've identified the institutional zone, not an arbitrary support/resistance level.
Target the Opposite Liquidity
Your take-profit target is the liquidity on the other side. If you entered long after an SSL sweep, your target is the next BSL level (equal highs, swing high). If you entered short after a BSL sweep, your target is the next SSL level. This gives you a defined risk-reward ratio based on the market's own structure, not an arbitrary multiple.
The formula: HTF structure (direction) + Liquidity (fuel) + Sweep (trigger) + OB/FVG (entry) + Opposite liquidity (target). Every element has a job. Remove one and the setup isn't valid. That discipline is what separates SMC from random support/resistance trading.
Manual SMC vs. Automated SMC Detection
You now know the strategy. The next question is implementation. SMC analysis requires identifying swing points, marking zones, tracking structure breaks, and monitoring multiple timeframes — all simultaneously. Doing this manually is entirely possible and many traders do. But it's worth comparing the two approaches honestly.
The honest truth: manual practice is essential for learning. You should draw Order Blocks by hand, identify FVGs yourself, and track structure until you internalize the logic. That process builds the intuition no tool can replace.
But once you've internalized the concepts, manual detection becomes the bottleneck. You can analyze one chart in 15 minutes. A tool can analyze every chart instantly. You miss patterns when you're tired or distracted. A tool doesn't. You draw zones slightly differently on Tuesday than Thursday. A tool uses the same logic every time.
The strategy is yours. The implementation is where automation earns its keep. Learn the framework manually. Execute it with precision.
6 Common SMC Mistakes That Kill Accounts
SMC is powerful, but it's not idiot-proof. The framework can be misapplied in ways that are worse than not using it at all. Here are the mistakes that separate struggling SMC traders from profitable ones:
1. Trading Every Order Block
Not all Order Blocks are equal. An OB from 3 weeks ago that has been tested twice is weaker than a fresh OB that caused a BOS. Filter your OBs: only trade those that (a) created a structural break, (b) haven't been tested more than once, and (c) align with higher-timeframe direction. Quality over quantity.
2. Ignoring Higher-Timeframe Structure
The most common killer. A perfect bullish setup on the 15-minute chart means nothing if the 4-hour chart is in a bearish BOS. Lower-timeframe signals must align with higher-timeframe structure. Always start analysis from the top down: daily → 4H → 1H → 15M. Never trade an LTF setup against HTF direction.
3. Calling CHoCH Too Early
A wick below a minor swing low in a strong uptrend is not a CHoCH. It's a liquidity grab. Real CHoCH breaks are decisive — they close beyond the level with commitment. If you're labeling 3–4 CHoCH signals per day, your swing point identification is too granular. Zoom out. Use significant swing points, not every minor wiggle.
4. No Confluence
An Order Block on its own is a zone. An Order Block that overlaps with an FVG and sits at a key liquidity level after a sweep — that's a high-probability trade. The best SMC setups have multiple concepts stacking at the same level. If your entry is based on a single concept with no supporting evidence, your win rate will suffer.
5. Overcomplicating It
SMC has a terminology problem. Between ICT, SMC Twitter, and YouTube educators, the same concepts get relabeled into increasingly exotic terms — "Breaker Blocks," "Mitigation Blocks," "Propulsion Blocks." The core framework is four concepts and liquidity. Master those. Everything else is a variation. When your chart has 47 drawn zones across 6 timeframes, you've lost the plot.
6. Forgetting Risk Management
SMC gives you better entries. It doesn't make every trade a winner. A 60% win rate still means 4 out of 10 trades lose. If you're risking 5% per trade because "the Order Block is so clean," one bad streak wipes weeks of progress. Standard risk management applies regardless of framework: 1–2% per trade, defined stop loss, no moving stops to "give it room."
Frequently Asked Questions
See Order Blocks, FVGs & Structure Breaks on Your Chart
Automatically. On every asset. Every timeframe.
The GOAT Toolkit detects every SMC pattern in real-time and scores confluence 0–100. 7-day free trial. No credit card.
Start Your Free Trial →No credit card. Full access. All three indicators. Cancel anytime.
DEEP DIVE
Order Blocks: The Complete TradingView Guide →
DEEP DIVE
Fair Value Gaps (FVG): How to Trade Them →
DEEP DIVE
BOS vs. CHoCH: The Difference Explained →
⚠ NFA — Not financial advice. Algoat.TV provides educational and analytical tools only. All trading decisions are yours. Trading involves risk of loss. Past performance does not guarantee future results.