Fair Value Gaps (FVG): How to Trade Them
Three candles. That's all it takes to spot an institutional footprint. The problem is, most traders stare right at it and see nothing.
Every time price moves aggressively in one direction, it leaves behind evidence. Not a rumor. Not a feeling. A structural gap in the price action that tells you exactly where orders went unfilled — and where price is statistically likely to return. That evidence is called a Fair Value Gap, and it's one of the most reliable concepts in Smart Money trading.
This guide breaks down exactly what Fair Value Gaps are, why they form, why roughly 70% of them get filled, and how to trade them with a structured, repeatable approach. No guesswork. No mysticism. Just market microstructure and institutional logic.
A Fair Value Gap (FVG) is a three-candle pattern where candle 1's wick and candle 3's wick don't overlap, leaving a visible gap in the price action. This gap represents an imbalance — price moved so aggressively that orders couldn't fill evenly across every price level. Roughly 70% of FVGs get filled as price returns to rebalance the inefficiency, making them one of the highest-probability zones for entries in Smart Money Concepts trading.
Table of Contents
What Is a Fair Value Gap?
A Fair Value Gap is a three-candle formation where the wicks of candle 1 and candle 3 fail to overlap, creating a gap in the price action between them. The middle candle (candle 2) is the aggressive, large-bodied candle that caused the gap — it moved so far, so fast, that price skipped through an entire zone without enough opposing orders to fill the space evenly.
In a bullish FVG, the gap exists between candle 1's high and candle 3's low. In a bearish FVG, the gap exists between candle 1's low and candle 3's high. That gap — the zone between those two wick extremes — is the Fair Value Gap.
The Microstructure Behind the Gap
Fair Value Gaps aren't random chart anomalies. They're a direct consequence of how markets actually process orders. At every price level in a healthy market, there's a relatively balanced exchange of buy and sell orders. Buyers absorb asks, sellers absorb bids, and price moves incrementally through each tick. This is efficient price delivery.
But when a large institution dumps a massive order into the book — or when a news catalyst hits and participants rush to one side — the balance breaks. Buying or selling pressure becomes so one-sided that price jumps through a range of price levels without enough opposing orders to transact at each one. The result: a zone where price was delivered inefficiently. Some price levels within that zone had little to no volume traded on them. The market essentially left "unfinished business" behind.
That unfinished business is your Fair Value Gap. And the market, driven by algorithms designed to seek efficient price delivery, has a statistical tendency to return and fill it.
How to Read the Three-Candle Pattern
Here's the anatomy, candle by candle:
Candle 1 (the setup): The candle immediately before the impulsive move. Its high (in a bullish scenario) or low (in a bearish scenario) establishes one boundary of the gap.
Candle 2 (the impulse): The large-bodied candle that drives the move. This is where the imbalance lives. Its body and wicks stretch so far in one direction that it creates the gap between candles 1 and 3. The larger this candle's body relative to surrounding candles, the more significant the imbalance.
Candle 3 (the confirmation): The candle that follows the impulse. Its wick must fail to reach back and overlap with candle 1's wick. If the wicks overlap, there's no gap — price was delivered efficiently. If they don't overlap, the gap is confirmed and you have a valid FVG.
This is not magic. It's not a secret pattern. It's a direct, visible record of inefficient price delivery on your chart. The gap tells you where the market owes a visit. Whether it pays that debt immediately or waits fifty candles depends on context, momentum, and the broader market structure — which is exactly why FVGs require confluence to trade well.
Bullish vs. Bearish Fair Value Gaps
Fair Value Gaps come in two flavors, each marking a different side of the imbalance. Understanding the distinction determines whether you treat the gap as a buy zone or a sell zone.
Bullish Fair Value Gap
Forms during an upward impulsive move. The gap zone sits between candle 1's high and candle 3's low.
- Created by overwhelming buying pressure
- Acts as a support/buy zone when price returns
- Candle 2 has a large bullish body
- Strongest when it aligns with bullish HTF trend
- Valid when candle 1's high does not touch candle 3's low
Bearish Fair Value Gap
Forms during a downward impulsive move. The gap zone sits between candle 1's low and candle 3's high.
- Created by overwhelming selling pressure
- Acts as a resistance/sell zone when price returns
- Candle 2 has a large bearish body
- Strongest when it aligns with bearish HTF trend
- Valid when candle 1's low does not touch candle 3's high
What Makes an FVG "Valid"?
Not every three-candle sequence with a gap qualifies as a tradeable Fair Value Gap. Valid FVGs share specific characteristics that separate institutional imbalances from random noise.
1. Clear wick separation. The wicks of candle 1 and candle 3 must have a visible, measurable gap between them. If they barely miss each other by a fraction of a pip, it's not a meaningful imbalance. Wider gaps represent more aggressive displacement and carry higher probability.
2. Displacement on candle 2. The middle candle must be large-bodied relative to surrounding price action. A small-bodied candle 2 with tiny wicks doesn't indicate institutional involvement — it's just a slow drift. You want to see conviction: a candle that covers ground decisively.
3. Context within structure. An FVG that forms within a larger trend, after a break of structure, or near a key institutional reference point is significantly more tradeable than one floating in choppy, range-bound price action. Context is what converts a pattern into a setup.
Why ~70% of FVGs Get Filled
The statistic that roughly 70% of Fair Value Gaps get revisited isn't arbitrary. It's rooted in how modern markets operate and the algorithmic infrastructure that drives institutional order execution.
The Rebalancing Theory
Markets have a fundamental tendency toward equilibrium. When price delivers inefficiently — skipping through levels without balanced order execution — it creates a natural magnet for future price action. Think of it as debt. The market borrowed momentum to move through that zone, and at some point, it returns to settle the balance sheet.
This isn't a metaphor. It's how institutional execution algorithms actually work. Market makers and large participants use algorithms specifically designed to identify inefficiencies in price delivery. When they see a zone where limited volume transacted, their algorithms target that zone for future fills. It's more profitable to execute orders at price levels where thin liquidity previously created favorable conditions than to compete in already-efficient zones.
The "Unfinished Business" Effect
When an FVG forms, it means orders that should have been filled at those price levels were left behind. Buyers who wanted to sell into the rally didn't get the chance. Sellers who wanted to buy the dip missed it entirely. These unfilled orders create latent demand or supply sitting in the gap zone. When price retraces back into the FVG, those resting orders trigger, creating the absorption and reaction that Smart Money traders are looking for.
When FVGs Don't Fill
The 30% that don't fill are equally informative. When price creates an FVG and never looks back to fill it, it usually signals one thing: extreme, one-directional momentum. This happens during trend continuation when institutional participants have committed so much capital in one direction that there's no economic reason for price to retrace. The gap remains open indefinitely because the buying or selling pressure is relentless.
Unfilled FVGs serve as powerful directional markers. If you see a series of unfilled bullish FVGs stacking up behind price, you're looking at institutional commitment to the upside. Don't fight it. Those open gaps are telling you the smart money isn't done yet. The practical takeaway: an FVG that fills is a trading opportunity. An FVG that refuses to fill is a directional signal.
How to Trade Fair Value Gaps
Identifying FVGs is the easy part. Trading them profitably requires a structured approach to entries, confirmation, stop placement, and targets. Here's the framework.
Step 1: Establish Higher Timeframe Bias
Before you even look for FVGs on your trading timeframe, identify the trend on the higher timeframe. A bullish FVG on the 15-minute chart is only worth trading if the 4-hour or daily chart confirms a bullish directional bias. If you're buying into a bearish FVG on a higher timeframe, you're trading against institutional flow. The HTF sets the direction; the FVG gives you the entry.
Step 2: Wait for Price to Return to the FVG Zone
This is where patience separates professionals from amateurs. Don't chase price after the impulsive move that created the FVG. Wait for the retracement. Price needs to pull back into the gap zone before you have a setup. Some FVGs fill within a few candles. Others take days. Some never fill. Let price come to you — never the other way around.
Step 3: Look for Confirmation
When price enters the FVG zone, don't blindly hit the buy or sell button. Wait for evidence that the gap is holding. A rejection candle — a long wick into the gap followed by a close back in the trend direction — is one of the strongest confirmations. A lower timeframe break of structure within the FVG zone is even better. Volume spikes on the reaction add another layer of conviction. The more confirmation signals that stack up, the higher the probability of the trade.
Step 4: Place Your Stop Loss
Your stop goes beyond the FVG zone — past the far boundary with a small buffer. For a bullish FVG entry, your stop sits below the bottom of the gap (candle 1's high, minus a buffer). For a bearish FVG entry, your stop sits above the top of the gap (candle 1's low, plus a buffer). If price fully trades through the FVG, the imbalance theory is invalidated and there's no reason to hold the position.
Step 5: Target the Next Structural Level
Your take-profit targets the next significant structural reference. For long trades from a bullish FVG, target the nearest swing high, an opposing FVG, or the next liquidity pool above current price. For shorts, target the nearest swing low or sell-side liquidity below. Price is attracted to liquidity, so opposing liquidity pools make reliable targets.
Critical Reminder
Fair Value Gaps alone aren't enough for high-probability entries. FVGs tell you where price is likely to react, but they don't tell you if the reaction will hold. Combine FVGs with break of structure (BOS) for trend confirmation and order blocks for zone confluence. A standalone FVG is a point of interest. An FVG with structural confluence is a trade setup.
FVG + Order Block Confluence
If a Fair Value Gap shows you where price was delivered inefficiently, and an order block shows you where institutional orders are resting, then the overlap of the two is the highest-conviction zone on the chart. This is what Smart Money traders call stacked confluence — and it's where the best trades live.
How the Two Concepts Align
Recall that an order block is the last opposite-color candle before a strong impulsive move that breaks structure. Now recall that an FVG forms when that impulsive move is so aggressive that it leaves a gap. These two events are directly linked. The order block is the origin of the move; the FVG is the trail it leaves behind. When price retraces, it often returns through the FVG and into the order block — hitting two institutional magnets at the same price zone.
Here's the mechanic: institutional algorithms that created the order block left behind unfilled orders. The FVG that formed during the displacement represents inefficient price delivery that the market tends to revisit. When price returns to fill the FVG and simultaneously taps the order block, you get a double reaction — the unfilled orders from the OB trigger while the market rebalances the inefficiency from the FVG. Two independent reasons for price to react at the same level.
Trading the Overlap
When you identify an FVG that overlaps with an unmitigated order block:
- Entry zone narrows: Instead of trading the entire FVG or the entire OB, you trade the overlap. This gives you a tighter entry zone and better risk-to-reward.
- Confidence increases: Two independent SMC concepts pointing to the same zone means the probability of a reaction is materially higher than either concept alone.
- Stop placement tightens: Your stop goes below the overlap zone rather than below the full OB, tightening your risk while keeping the same targets.
- Invalidation is clearer: If price slices through both the FVG and the OB without reacting, the setup is definitively dead. No ambiguity. No hoping.
This is why experienced Smart Money traders don't trade FVGs or order blocks in isolation. They look for the stack. The more independent institutional concepts that align at a single price zone, the sharper the edge. An FVG alone is a 60-70% probability zone. An FVG stacked with an unmitigated order block, aligned with HTF trend, and preceded by a liquidity sweep is a setup worth sizing into.
Common FVG Mistakes
Fair Value Gaps are simple to spot but easy to trade poorly. Here are the mistakes that drain accounts.
Mistake 1: Trading Every Gap You See
FVGs form constantly on every timeframe. If you trade every single one, you're not using a strategy — you're pattern-matching without context. The filter is simple: only trade FVGs that align with the higher timeframe directional bias. A bullish FVG on the 5-minute chart during a daily bearish trend is a counter-trend trap, not a setup. Discipline here separates profitable FVG traders from the rest.
Mistake 2: Expecting 100% Fill Rate
About 70% of FVGs fill. That means 30% don't. If you build your trading plan around the assumption that every gap will fill, you're setting yourself up for a rough drawdown when price trends relentlessly in one direction without looking back. Always use a stop loss. Always size your position assuming the trade could fail. The 70% fill rate is an edge, not a guarantee.
Mistake 3: Ignoring the Context Around the FVG
An FVG that forms after a break of structure in a trending market is significantly more reliable than one that forms in a choppy, range-bound environment. Context includes: Was there a preceding liquidity sweep? Did the move break a structural level? Is the FVG sitting near a higher timeframe point of interest? Without context, an FVG is just three candles. With context, it's a trade.
Mistake 4: Not Using a Stop Loss
"The gap has to fill eventually" is the most expensive sentence in trading. Some FVGs never fill. And even the ones that do might wick through your entry zone, run your anticipated stop area, and then fill from a much deeper level. If you're holding without a stop because you believe the FVG must fill, you're not trading — you're hoping. Define your invalidation before the entry, place the stop, and accept the outcome.
Mistake 5: Using FVGs in Isolation
A Fair Value Gap is one piece of the puzzle. It tells you where an imbalance exists, but it doesn't tell you market direction, it doesn't confirm institutional intent, and it doesn't define the structural context. Combine FVGs with order blocks for zone confluence, break of structure for trend confirmation, and liquidity concepts to understand where price is heading. The best FVG trades are never just FVG trades — they're confluence trades where the FVG happens to be one of multiple factors aligning.
Manual vs. Automated FVG Detection
You now understand the full framework for identifying and trading Fair Value Gaps. The question is: do you want to do this manually on every chart, every timeframe, every session — or do you want it done in real time?
| Criteria | Manual Detection | GOAT Toolkit (Automated) |
|---|---|---|
| Speed | Scan every 3-candle sequence manually | Instant — real-time FVG detection |
| Consistency | Varies with fatigue and screen time | Same algorithm, every candle, zero drift |
| Multi-timeframe | Switch charts, redraw zones per TF | Cross-timeframe analysis built in |
| Gap validation | Visual check — subjective wick measurement | Algorithmic wick-gap calculation |
| Fill tracking | Must monitor manually, easy to miss | Auto-tracks filled vs. unfilled FVGs |
| OB confluence | Cross-reference zones manually | FVGs + OBs detected as part of SMC engine |
| Scoring | Gut feel on gap quality | FVGs feed into composite 0-100 score |
| Human bias | Confirmation bias affects zone selection | Zero emotional interference |
Here's the reality: you just learned exactly how Fair Value Gaps work. You understand the three-candle pattern, why gaps fill, how to trade them, and how to combine them with order blocks for stacked confluence. You could open six charts, switch between three timeframes each, and spend the next hour scanning for valid FVGs, drawing zones, and cross-referencing them against order blocks.
Or you could open a single chart and see every FVG already marked, color-coded by direction, tracked for fill status, overlaid with order blocks and structural breaks, and fed into a composite score that tells you how strong the setup is from 0 to 100.
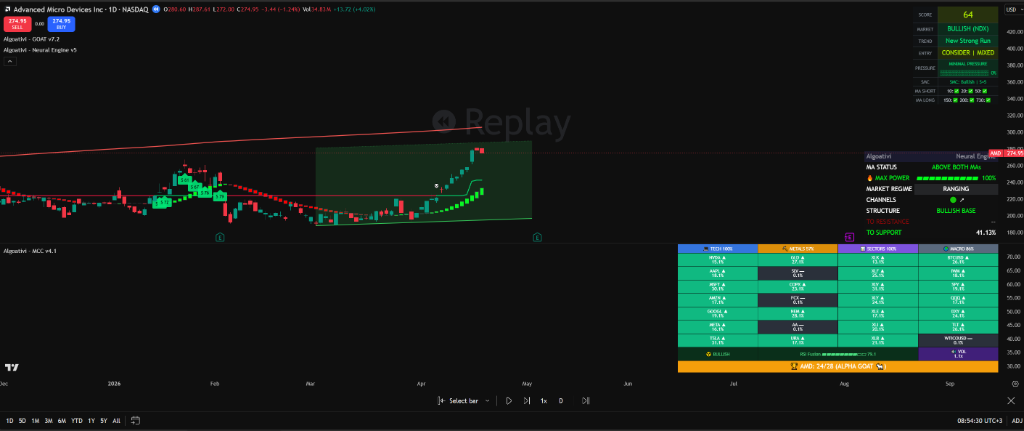
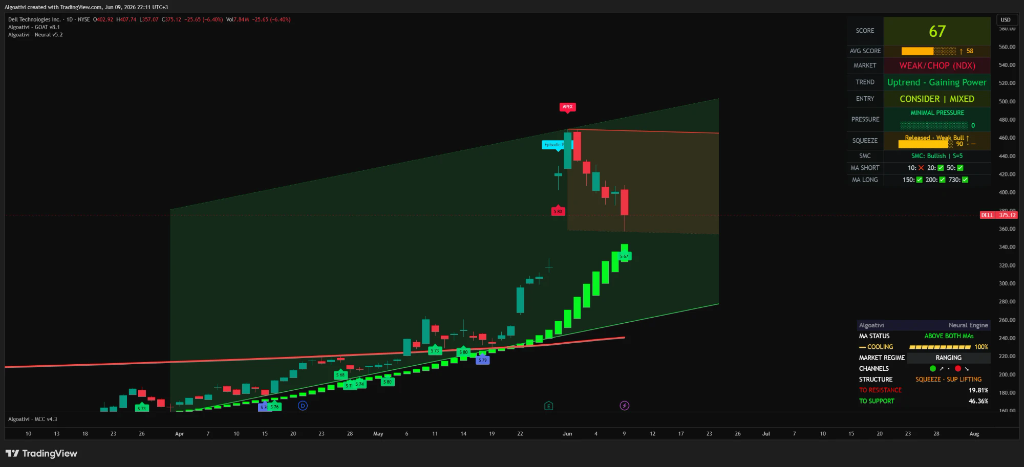
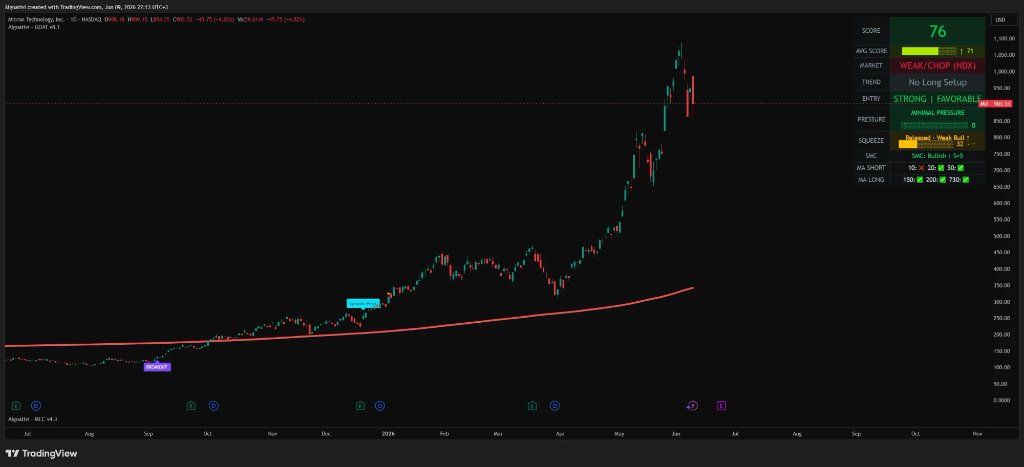
That's what the GOAT Toolkit does. FVGs are one component of its Smart Money Concepts engine — automatically detected, automatically validated, automatically scored alongside order blocks, BOS, and structural context. The framework you just learned, running on every candle, in real time.
See It In Action
Fair Value Gaps detected automatically on every chart.
Part of the GOAT Toolkit's SMC engine — 7 days free. No credit card required.
Start Free TrialFrequently Asked Questions
Do Fair Value Gaps work on crypto?
Yes. FVGs form on any asset with a continuous order book — forex, stocks, commodities, and crypto. In fact, crypto markets often produce some of the cleanest FVGs because volatility tends to be higher and impulsive moves are more pronounced. Bitcoin and Ethereum on the 1-hour and 4-hour timeframes are particularly well-suited for FVG trading because the 24/7 market structure means there's always liquidity to absorb, and the large candle-body displacements create clearly defined gaps. The same three-candle mechanics apply universally.
What timeframe is best for trading FVGs?
There's no single best timeframe, but the most reliable FVGs form on the 1-hour, 4-hour, and daily charts. These timeframes capture institutional-level moves with enough volume behind them to create meaningful imbalances. Lower timeframes (1M, 5M, 15M) produce valid FVGs, but they fill faster, offer less room for stops, and carry more noise. The most common approach: use the 4H or daily to identify FVGs that establish directional bias, then drop to the 15M or 5M for precision entries within those zones.
Do all Fair Value Gaps fill?
No. Roughly 70% of FVGs get revisited, but 30% remain open — typically during strong trending conditions where momentum is extreme and one-directional. An unfilled FVG isn't a failed pattern; it's a directional signal. If price keeps creating new FVGs in the same direction without filling previous ones, it tells you institutional flow is aggressive and unfinished. The key insight: partial fills are also common. Price may enter the FVG zone, fill 50-75% of it, and then reverse — which is why many traders target the midpoint (50% level) of the FVG as the optimal entry zone rather than waiting for a full fill.
Is a Fair Value Gap the same as a CME gap?
No — they're fundamentally different concepts. A CME gap is a price gap that forms between the Friday close and Sunday open of the Chicago Mercantile Exchange, caused by the exchange being physically closed while the underlying asset (like Bitcoin) continues trading on other venues. An FVG, by contrast, forms during live trading and is caused by an imbalance in order flow, not by a market closure. Both tend to get "filled," but for completely different reasons. CME gaps fill because price converges toward the exchange's last known level. FVGs fill because inefficient price delivery creates zones where unfilled orders rest. Don't conflate the two in your analysis — they require different trading approaches.
Can I use FVGs for scalping?
Yes, but with conditions. FVG scalping works best on the 1-minute to 5-minute timeframes during high-volume sessions (London open, New York open, or session overlaps). The approach: identify FVGs on the 5M or 15M chart, wait for price to retrace into the gap during the session, and take quick entries with tight stops targeting the next micro-structure level. The critical filter for scalping FVGs is session timing — FVGs that form during low-volume Asian session hours are far less reliable than those formed during London or New York. Also, scalping FVGs requires fast execution and tight spreads, so this approach works better on major forex pairs and large-cap crypto than on illiquid instruments.
How do I tell if an FVG has already been filled?
An FVG is considered filled when price retraces back into the gap zone and trades through it. If price enters the zone and a candle closes within or beyond the opposite boundary of the FVG, the gap is filled. Partial fills occur when price enters the gap but doesn't fully close the zone — these are still tradeable if price reacts from within the gap. Once an FVG is fully filled, it loses its relevance as a trading zone because the inefficiency has been resolved. The GOAT Toolkit automatically tracks FVG fill status in real time, distinguishing between unfilled, partially filled, and fully filled gaps so you never trade a dead zone.
FVGs detected. Order blocks marked.
Structure breaks labeled. All automatic.
The GOAT Toolkit's SMC engine runs the framework you just learned — on every candle, in real time.
7-day free trial. No credit card required.