Break of Structure vs. Change of Character: The Difference
Every trend ends. The question is whether you see it ending or whether you're the last person holding when it does.
Two signals control the narrative of every chart. One tells you the trend is alive and pushing forward. The other tells you the trend just took its first breath of weakness — and something may have shifted underneath. If you can't tell the difference between these two signals, you're trading blind in exactly the moments where clarity matters most.
Those two signals are Break of Structure (BOS) and Change of Character (CHoCH). Together, they form the structural backbone of Smart Money Concepts trading — the framework that tells you when to stay in a trend, when to start questioning it, and when to position for the other side. This guide breaks down both, side by side, with zero ambiguity.
Break of Structure (BOS) confirms trend continuation — the market breaks the previous swing high or swing low in the direction of the existing trend. Change of Character (CHoCH) signals a potential reversal — the market breaks structure in the opposite direction for the first time. BOS says "keep going." CHoCH says "something changed." One keeps you in the trade. The other tells you to pay attention before you become the exit liquidity.
Table of Contents
What Is Market Structure?
Before you can understand BOS or CHoCH, you need to understand the thing they're describing: market structure. Structure is the skeleton of every chart. Strip away the indicators, the moving averages, the oscillators, and the trendlines — what's left is a series of swing highs and swing lows. That sequence is market structure, and it tells you one thing with absolute clarity: who is currently in control.
Bullish structure is defined by a series of higher highs (HH) and higher lows (HL). Each new swing high exceeds the previous one. Each pullback holds above the prior low. Buyers are in control. The market is making progress to the upside, and each dip finds willing participants to push it higher. As long as this pattern persists, the trend is intact.
Bearish structure is the mirror image: lower highs (LH) and lower lows (LL). Each rally fails at a lower level than the one before. Each drop pushes below the previous low. Sellers control the tape, and every bounce is a fresh opportunity for distribution. The bearish trend persists as long as this sequence holds.
This isn't an indicator. It isn't a theory. It's the raw, observable reality of what price is doing. Every chart, every timeframe, every asset class follows this same structural logic. And every meaningful move on a chart either continues that structure or breaks it.
Why Structure Is the Foundation of Everything
Structure isn't one tool among many. It's the foundation that everything else sits on. Order blocks mean nothing without structural context. Fair value gaps need directional bias to tell you which ones to trade. Liquidity sweeps only make sense when you understand where the structural levels are that define the trend. Without structure, you're just drawing zones on a chart and hoping something happens.
Think of it this way: structure is the skeleton. Order blocks, FVGs, and liquidity zones are the flesh on the bones. You don't build a body by piling muscles onto air — you need bones first. And those bones are defined by two events: the moment structure continues (BOS) and the moment structure cracks (CHoCH).
Understanding exactly when each of those events occurs — and what to do when they do — is what separates traders who read structure from traders who get trapped by it.
Break of Structure (BOS) Explained
A Break of Structure is exactly what it sounds like: price breaks the most recent significant swing point in the direction of the existing trend. It's the market saying, "The trend is alive. We're still going." Every BOS confirms that the current side — buyers or sellers — is still firmly in control and willing to push price beyond the last structural boundary.
BOS doesn't predict anything. It confirms. It tells you after the fact that the structural sequence is intact. In a bullish trend, BOS occurs when price breaks above the most recent swing high, creating a new higher high. In a bearish trend, BOS occurs when price breaks below the most recent swing low, creating a new lower low. The key detail: the break must happen in the direction of the prevailing trend, not against it. If it breaks against the trend, it's not BOS — it's CHoCH.
Bullish BOS
Price breaks above the most recent swing high in an existing uptrend, creating a new higher high and confirming bullish continuation.
- Precondition: Established bullish structure (HH, HL)
- Trigger: Candle body closes above the previous swing high
- Meaning: Buyers still in control — trend intact
- Action bias: Look for long entries on pullbacks
- New reference: The broken swing high becomes the new structural level
Bearish BOS
Price breaks below the most recent swing low in an existing downtrend, creating a new lower low and confirming bearish continuation.
- Precondition: Established bearish structure (LH, LL)
- Trigger: Candle body closes below the previous swing low
- Meaning: Sellers still in control — trend intact
- Action bias: Look for short entries on rallies
- New reference: The broken swing low becomes the new structural level
Body Close vs. Wick: What Counts as a Real BOS?
This is where a lot of traders get burned. A wick poking above a swing high is not a BOS. A wick is a rejection — it tells you price reached that level and got pushed back. Institutions use wick-sweeps to grab liquidity above swing highs before sending price the other direction. If you treat every wick as a BOS, you'll enter on continuation setups right as the market reverses into your face.
A valid BOS requires a candle body close beyond the structural level. The body close shows committed participation — the candle opened, traded through the level, and closed on the other side. That's conviction. A wick poke followed by a close back below is not conviction. It's a failed test, and often it's a setup for the opposite move.
This distinction is critical. Many traders who complain that "BOS doesn't work" are actually trading wick sweeps, not genuine structural breaks. The difference between a validated BOS and a liquidity sweep is often the difference between a winning trade and a stopped-out one.
What BOS Tells You About Institutional Intent
Every BOS is, at its core, a signal of continued institutional commitment. When price creates a new higher high in a bullish trend, it means the large participants who initiated the trend are still active. They haven't finished building their position, or they haven't reached their target. The supply that should have stopped the advance wasn't enough. The buyers absorbed it and pushed through.
This is why trading with BOS is fundamentally a trend-following strategy. You're aligning with the confirmed direction of institutional flow. You're not predicting — you're confirming. And in a market where 70-80% of retail traders lose money by fighting trends, confirmation is a significant edge.
Change of Character (CHoCH) Explained
If BOS is the green light that says "trend continues," CHoCH is the amber light that says "something just changed." A Change of Character occurs when price breaks structure in the opposite direction of the prevailing trend for the first time. It's the first crack in the wall — the first structural evidence that the dominant side may be losing control.
In a bullish trend, CHoCH occurs when price breaks below the most recent swing low. The sequence of higher highs and higher lows has been violated. For the first time, price made a lower low — something it hadn't done while the bullish structure was intact. That break doesn't mean the trend is over. But it does mean the structural pattern that defined the trend is no longer intact. The character of the market has changed.
In a bearish trend, CHoCH occurs when price breaks above the most recent swing high. The pattern of lower highs and lower lows breaks. For the first time, buyers pushed price high enough to exceed a previous structural peak. The bearish character has shifted.
The Critical Difference: First Break vs. Continuation Break
Here's the distinction that trips up most traders: both BOS and CHoCH involve price breaking a swing point. The difference is entirely about direction relative to the trend. If the break happens in the same direction as the existing trend, it's a BOS. If the break happens against the trend — and it's the first time that has occurred — it's a CHoCH.
The "first time" part matters. CHoCH is specifically the initial structural violation. After the first CHoCH, if price continues to break structure in the new direction, those subsequent breaks become BOS in the new trend. CHoCH is a one-time event per trend transition. It's the inflection point — the moment where the old trend ends and the potential new trend begins.
CHoCH Sequence — Bullish-to-Bearish Transition
HH → HL → HH → HL. Bullish structure intact. Each swing high exceeds the last.
Price makes a new HH but the impulse is weaker. Pullback deepens. Sellers stepping in.
Price breaks below the most recent swing low. First lower low. Bullish structure violated.
If price follows through with a lower high, bearish structure forms. CHoCH was the inflection point.
CHoCH Does NOT Guarantee Reversal
This cannot be overstated: a CHoCH is a warning signal, not a reversal confirmation. It tells you the existing trend's structural integrity has been compromised. It does not tell you a new trend in the opposite direction has begun. The difference is enormous — and failing to respect it is how traders blow accounts.
After a CHoCH, the market can do one of three things. It can follow through and establish a new trend in the opposite direction — this is what every trader hopes for. It can range sideways, consolidating between the CHoCH level and the previous structural extreme — this is common and frustrating. Or it can resume the original trend, treating the CHoCH as nothing more than a deep pullback that swept liquidity before continuing — and this happens more often than most traders want to admit.
CHoCH gives you a reason to stop trading with the old trend. It does not automatically give you a reason to trade against it. That requires follow-through, confluence, and patience — three things that most retail traders are notoriously bad at providing.
BOS vs. CHoCH — Side-by-Side Comparison
Both involve structural breaks. Both involve price moving past a swing point. The difference is what they mean, when they happen, and what you do next. Here's the breakdown:
The fundamental lesson from this comparison: BOS is the safer, higher-probability signal. It confirms what's already happening. CHoCH is the more exciting signal — the one that catches reversals — but it's also the one that creates the most false positives and costs traders the most money when used recklessly.
Most consistently profitable SMC traders make the majority of their income on BOS-based continuation trades. CHoCH gives them the edge to exit positions early and occasionally catch the turn — but it's the BOS trades that pay the bills.
How to Trade BOS and CHoCH
Understanding BOS and CHoCH conceptually is one thing. Turning them into actual trade entries with defined risk and clear targets is where the money is. Here's how each one translates into a structured trading approach.
Trading BOS: The Continuation Entry
Identify the trend and confirm BOS
Confirm that structure is intact — you need at least two swing points forming HH/HL or LH/LL. Then watch for price to break the most recent swing point in the trend direction with a candle body close. That's your BOS.
Wait for the pullback
Do not chase the BOS candle. After structure breaks, price almost always retraces. That pullback is your entry window. Look for price to retrace into an order block, Fair Value Gap, or the 50-61.8% Fibonacci zone of the impulse that created the BOS.
Place the entry and define risk
Enter as price reacts from the pullback zone. Stop loss goes below the BOS candle's low (for bullish BOS) or above the BOS candle's high (for bearish BOS). The BOS level is your invalidation — if price closes back through it, the trade thesis is dead.
Target the next structural level
Your initial target is the next significant swing point — the level where you'd expect the next BOS or potential CHoCH to occur. In strong trends, you can trail your stop behind each new swing low (bullish) or swing high (bearish) as the structure develops.
Trading CHoCH: The Transition Entry
CHoCH trading is fundamentally different from BOS trading. With BOS, you're trading with the crowd. With CHoCH, you're positioning for a shift — which means you're early, and being early without confirmation is how accounts die.
Identify the CHoCH — first counter-trend break
In a bullish trend, price breaks below the most recent swing low with a candle body close. In a bearish trend, price breaks above the most recent swing high. This is the CHoCH — but it's only a signal to pay attention, not a signal to trade.
Do NOT immediately reverse — wait for confirmation
This is the step most traders skip, and it's the step that saves your account. After CHoCH, wait for at least one of these confirmations: a Fair Value Gap fill in the new direction, an order block rejection on the retest, or a second CHoCH/BOS confirming the new directional bias.
Enter on the pullback after confirmation
Once you have confirmation, treat the trade like a BOS trade in the new direction. Wait for the pullback into an order block or FVG, enter with a defined stop, and target the first structural level in the new trend.
Manage risk aggressively
CHoCH trades are inherently lower-probability than BOS trades because you're betting on a trend change. Use smaller position sizes. Move to breakeven quickly after the first structural leg in the new direction. And if price reclaims the CHoCH level — get out. The market is telling you the old trend is still alive.
Common Mistake
Treating every CHoCH as a guaranteed reversal.
Most CHoCH signals that occur in the middle of a strong trend are not reversals — they're liquidity sweeps or deep retracements. The market breaks a swing low to grab stop losses, then resumes the original trend. If you flip your bias on every CHoCH without waiting for confirmation, you'll get chopped to pieces in trending markets. CHoCH is a signal to stop trading the old direction. It is not an automatic signal to trade the new one.
Why Premature CHoCH Identification Kills Accounts
If there's one section in this entire guide that can save you real money, it's this one. The single most dangerous habit in Smart Money Concepts trading is seeing CHoCH signals that aren't actually there — or worse, seeing real ones and acting on them without context. Both paths lead to the same outcome: you're repeatedly shorting into an uptrend or going long into a downtrend, getting stopped out every time, and blaming the concept instead of the application.
The Liquidity Sweep Trap
In a strong uptrend, institutions regularly sweep below swing lows to collect liquidity before pushing higher. Here's why: retail traders place their stop losses below swing lows. Institutions know this. They push price below those levels to trigger stops, absorb the resulting sell orders as their buy-side liquidity, and then drive price back into the trend direction.
On a chart, this looks exactly like a CHoCH. Price breaks below the most recent swing low. If you're labeling structure mechanically without context, you'd call it a Change of Character. But it's not — it's a liquidity sweep. The trend never actually shifted. The institution just needed your stop loss to fill their order, and they got it.
How to Filter Real CHoCH from Noise
Not every structural break against the trend is a genuine CHoCH. To filter the real ones from the noise, apply these three criteria:
Filter 1: Significant Level
The CHoCH must occur at a structurally significant level. A break below a minor swing low formed by two or three candles on a lower timeframe is not the same as a break below a major swing low visible on the higher timeframe. The more significant the swing point, the more meaningful the CHoCH.
Filter 2: Follow-Through
A real CHoCH gets follow-through. After the break, price should continue in the new direction — ideally forming a lower high (in a bullish-to-bearish CHoCH) or a higher low (in a bearish-to-bullish CHoCH). If price immediately reclaims the broken level, the CHoCH was a fakeout. Wait for the follow-through before committing.
Filter 3: Confluence
The strongest CHoCH signals occur at levels where other SMC tools align: an order block rejection, a Fair Value Gap fill, a higher-timeframe supply or demand zone, or a liquidity sweep of a key level above the structure. If CHoCH is the only signal, treat it with extreme skepticism. If three signals align, it's worth acting on.
The traders who get destroyed by CHoCH are the ones who see it on every minor swing break, on every timeframe, in every market condition. They end up counter-trend trading in strong trends — which is the exact opposite of what professional money managers do. Institutions don't fight trends. They ride them until structure says otherwise, and they use CHoCH as an exit signal, not an entry signal, until confirmation arrives.
The discipline here is straightforward: treat BOS as your default edge. Trade with the trend until CHoCH gives you a reason to stop. Then wait — patiently — until the new direction proves itself before committing capital to it. That patience is what separates the traders who catch reversals from the traders who get buried trying.
See It In Action
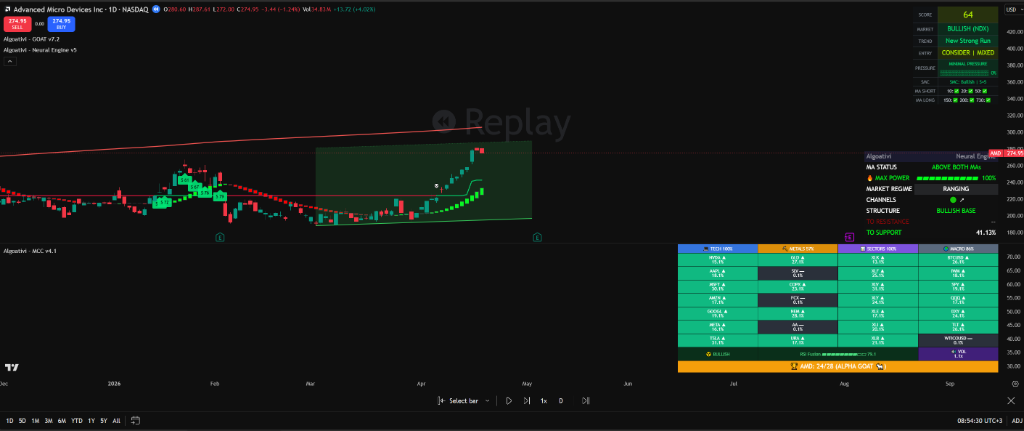
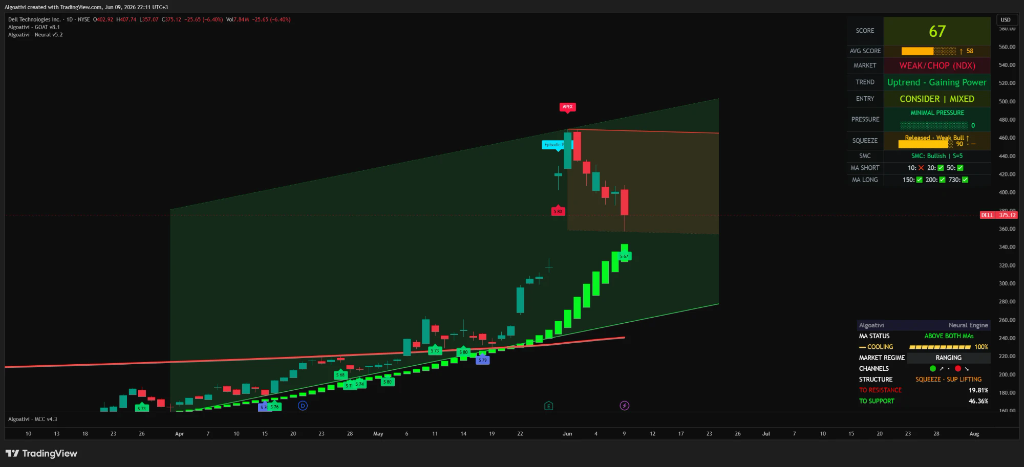
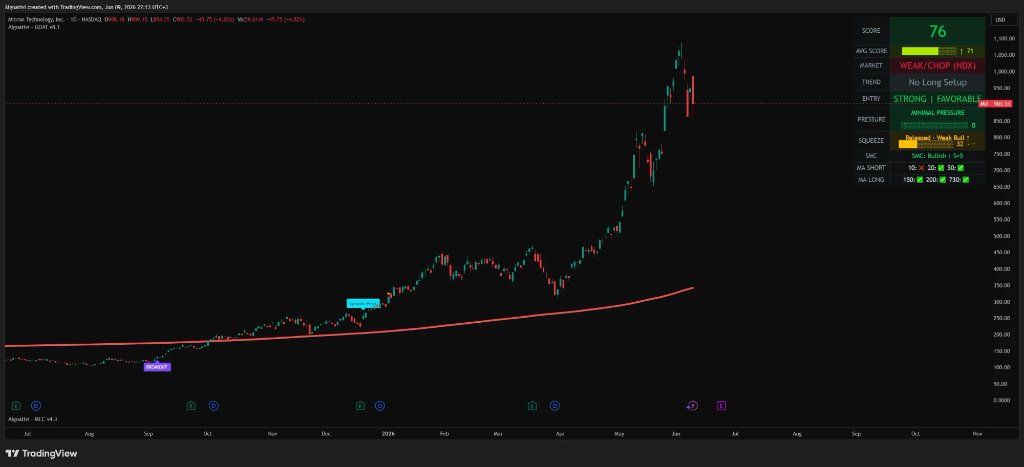
BOS and CHoCH detected automatically on every chart.
Part of the GOAT Toolkit's Smart Money Concepts engine — 7 days free. No credit card required.
Start Free TrialFrequently Asked Questions
Can BOS and CHoCH happen on any timeframe?
Yes. Market structure exists on every timeframe, from the 1-minute chart to the monthly chart, which means BOS and CHoCH can occur on any of them. However, the significance of the signal scales with the timeframe. A CHoCH on the daily chart carries far more weight than a CHoCH on the 5-minute chart because it reflects a larger shift in institutional positioning. The most effective approach is to use higher timeframes (4H, daily, weekly) to identify significant structural breaks and establish directional bias, then use lower timeframes (15M, 5M) for precision entries within that bias. A BOS on the daily tells you the trend is intact across hundreds of thousands of candles of lower-timeframe data. A BOS on the 1-minute might be irrelevant thirty minutes later.
How many CHoCH signals confirm a reversal?
A single CHoCH does not confirm a reversal — it only signals that the existing trend's structure has been compromised. For a reversal to be considered confirmed, you need the CHoCH followed by at least one structural move in the new direction: a lower high after a bullish CHoCH, or a higher low after a bearish CHoCH. Many traders wait for a full structural cycle in the new direction — a CHoCH followed by a new swing point followed by a BOS in the new trend direction — before committing to the reversal thesis. The more confirmation you require, the worse your entry price but the higher your win rate. This is a deliberate tradeoff, and each trader needs to decide where on that spectrum they sit based on their risk tolerance and trading style.
Is CHoCH the same as a trend reversal?
No. CHoCH is a necessary condition for a reversal, but it's not a sufficient one. Every trend reversal starts with a CHoCH, but not every CHoCH leads to a reversal. Think of it as a diagnostic test with a false-positive rate. In strong trending conditions, temporary structural breaks happen frequently — liquidity sweeps, stop hunts, and deep corrections can all produce CHoCH signals without the trend actually changing. CHoCH means the old trend's structural integrity is broken. It does not mean a new trend has begun. For that, you need follow-through: the formation of new structure in the opposite direction, confirmed by BOS in the new bias. Without follow-through, a CHoCH is just a deep pullback that happened to sweep a swing low.
Do BOS/CHoCH work better than trendline breaks?
They solve different problems, but BOS/CHoCH are more structurally objective. Trendlines are subjective — two traders can draw completely different trendlines on the same chart depending on which swing points they connect and whether they use bodies or wicks. BOS and CHoCH are defined by specific structural events: a swing high or swing low being broken with a candle body close. There's no ambiguity about which points to use or how to draw them. Additionally, BOS/CHoCH give you directional context that trendlines don't. A trendline break tells you the line was breached; it doesn't tell you whether the trend has actually shifted structurally. A trendline can break while the higher-high, higher-low sequence remains intact. BOS and CHoCH track the actual structural pattern, not a line drawn across it.
Can BOS and CHoCH detection be automated?
Yes, and there are strong arguments for doing so. Manual structure identification is subjective — you choose which swing points to use, how many candles define a "significant" swing, and when to classify a break as BOS vs. CHoCH. This subjectivity introduces bias, especially when you already have a directional opinion. Automation removes that bias entirely. The GOAT Toolkit detects BOS and CHoCH as part of its Smart Money Concepts engine, identifying swing points algorithmically, labeling structural breaks in real time, and distinguishing between continuation and character changes across multiple timeframes. The labels appear directly on your TradingView chart — no drawing, no subjective decisions, no confirmation bias influencing which breaks you notice and which ones you ignore.
BOS labeled. CHoCH detected. Structure mapped.
All automatic. Every candle. Every chart.
The GOAT Toolkit's SMC engine runs the structural framework you just learned — in real time, with zero subjectivity.
7-day free trial. No credit card required.