Order Blocks Explained: The Complete TradingView Guide
Every big move starts with a decision someone already made. You just can't see it — unless you know where to look.
Institutional traders don't move markets on a whim. They plan entries weeks in advance, accumulate positions over sessions, and leave behind structural evidence that most retail traders walk right past. That evidence? Order blocks.
This guide breaks down exactly what order blocks are, why they form, how to identify the ones that actually matter, and how to trade them with precision. No mysticism. No hand-waving. Just price action mechanics and institutional logic.
An order block is the last opposite-color candle before a strong impulsive move that breaks market structure. It marks the zone where institutional participants accumulated or distributed their positions. When price returns to this zone, unfilled institutional orders often trigger a reaction — making order blocks some of the highest-probability entry zones in Smart Money Concepts trading.
Table of Contents
What Is an Order Block?
An order block is the last candle of the opposing color that forms immediately before a strong, impulsive price move that breaks market structure. In plain terms: if price suddenly rockets upward and takes out a previous swing high, the last red (bearish) candle before that move is the bullish order block. If price collapses downward through a swing low, the last green (bullish) candle before the drop is the bearish order block.
But reducing order blocks to "just a candle" misses the entire point. The candle is a marker. What it represents is an institutional decision — a zone where large players placed significant orders that initiated the move you're now seeing on your chart.
Why Institutions Create Order Blocks
Consider this: a hedge fund needs to build a $400 million long position in EUR/USD. They can't just place a single market order. That kind of size would move the market instantly, giving them a terrible average fill price. Instead, they accumulate their position over time, buying in blocks across a defined price zone.
During accumulation, the price action often looks choppy or bearish on the surface. Retail traders see red candles and sell — which is exactly the liquidity institutions need to fill their buy orders. The last bearish candle in that sequence is the one where the final wave of selling occurs. Then the institution has enough of their position built, and price explodes upward.
That last bearish candle? That's your bullish order block. It is, quite literally, the footprint of institutional activity.
The Footprint Metaphor
Think of order blocks like footprints in snow. The institution has already walked through. You can't see the person anymore, but the prints tell you exactly where they stepped, which direction they were heading, and how heavy they were. In trading, the "footprint" is the order block zone. The "direction" is the impulse that followed. And the "weight" is the displacement — how aggressively price moved away from that zone.
The deeper the footprint (stronger displacement), the more likely the institution still has unfilled orders sitting in that zone. And that's exactly why price tends to return to order blocks before continuing in the original direction.
Bullish vs. Bearish Order Blocks
Order blocks come in two forms, each serving a different side of institutional positioning. Understanding the distinction is essential for trading them correctly.
Bullish Order Block
The last bearish (red) candle before a strong bullish impulse that breaks structure to the upside.
- Forms at the bottom of a move
- Represents institutional accumulation (buying)
- Acts as a support zone when price returns
- The impulse that follows must create a break of structure (BOS) to the upside
- Stronger when followed by a Fair Value Gap
Bearish Order Block
The last bullish (green) candle before a strong bearish impulse that breaks structure to the downside.
- Forms at the top of a move
- Represents institutional distribution (selling)
- Acts as a resistance zone when price returns
- The impulse that follows must create a break of structure (BOS) to the downside
- Stronger when followed by a Fair Value Gap
Characteristics of a Valid Order Block
Not every opposite-color candle before a move qualifies as an order block. Valid OBs share two non-negotiable characteristics:
1. It must break structure. The impulsive move following the order block must take out a significant swing high (for bullish OBs) or swing low (for bearish OBs). If the move doesn't break structure, the candle is just a candle — not an order block.
2. It must show displacement. Displacement means the move away from the order block was aggressive — large-bodied candles, minimal wicks, and often a Fair Value Gap left behind. Weak, grinding moves don't confirm institutional involvement. The displacement is your evidence that real money was behind the move.
How to Identify Valid Order Blocks
Identifying order blocks is a structured process, not a guessing game. Follow these steps every time you analyze a chart, and you'll separate the high-probability zones from the noise.
Step 1: Find an Impulsive Move
Scan your chart for a strong, directional price move — one that covers significant ground in a short period. You're looking for a cluster of large-bodied candles moving in one direction with minimal pullbacks. This is the impulse leg. If the move is slow and choppy, skip it. Institutional moves are clean and aggressive.
Step 2: Confirm It Broke Structure (BOS)
Did the impulsive move take out a previous swing high or swing low? This is the break of structure confirmation. For a bullish scenario, the impulse must close above a prior swing high. For bearish, it must close below a prior swing low. No break of structure means no valid order block — period. This filter alone eliminates the majority of false setups.
Step 3: Mark the Last Opposite-Color Candle
Look back from the start of the impulsive move and find the last candle that closed in the opposite direction. For a bullish impulse, mark the last red candle. For a bearish impulse, mark the last green candle. This is your order block. The zone extends from the candle body's open to its close (some traders use the full wick range for a wider zone, but the body is the core institutional interest area).
Step 4: Check for Displacement
Verify that the move away from your marked candle was explosive, not gradual. Look for large-bodied candles with small wicks. Ideally, you'll see a Fair Value Gap (FVG) form in the impulse leg — a three-candle pattern where the wicks don't overlap, leaving a visible gap. The presence of an FVG is one of the strongest displacement confirmations you can get.
Step 5: Validate with Higher Timeframe Context
A valid order block on the 15-minute chart means very little if it conflicts with a 4-hour bearish trend. Always check that your OB aligns with the higher timeframe directional bias. The strongest setups occur when a lower timeframe order block sits within a higher timeframe order block or point of interest — this is called a "nested" order block, and it dramatically increases the probability of a reaction.
Additional Filters for Higher-Probability OBs
- Volume confirmation: If you have access to volume data, the order block candle should show above-average volume, indicating real institutional participation rather than thin-market noise.
- Unmitigated status: An order block that has already been revisited and reacted from is considered "mitigated." Unmitigated (untouched) order blocks carry the highest probability because those unfilled orders are still resting in the zone.
- Liquidity sweep before the OB: If price swept a significant low (for bullish OB) or high (for bearish OB) just before forming the order block, it confirms that institutions engineered a stop hunt to accumulate their position.
Why Price Returns to Order Blocks
This is the question that separates traders who use order blocks as a mechanical checklist from those who actually understand them. The answer isn't magic. It's market microstructure.
The Unfilled Orders Theory
When an institution decides to build a position, they rarely fill the entire order in one pass. If they want to buy 50,000 contracts and the market only has 20,000 contracts of sell-side liquidity available at their target price, they get a partial fill. The remaining 30,000 contracts are left as resting orders in the zone.
Price moves away from the zone because the initial buying pressure overwhelmed available supply. But those 30,000 unfilled contracts are still there. The institution still wants that price. So when price pulls back to the order block zone, those resting orders absorb the selling pressure and push price back up.
This is why order blocks function as support and resistance. It's not a pattern. It's not a self-fulfilling prophecy. It's the mechanical result of large orders that couldn't be filled in a single execution pass.
Not Magic — Mechanics
Traditional support and resistance teaches you to draw horizontal lines where price "bounced" before. Order blocks explain why price bounced. The zone wasn't meaningful because price touched it — it was meaningful because someone with significant capital placed orders there that hadn't been fully executed.
This is also why order blocks eventually stop working. Once the institution's full order is filled (the block is "mitigated"), there's no remaining demand or supply sitting in the zone. The footprint has been walked over. Price may pass through it the next time without any reaction at all.
Understanding this distinction is critical: you're not trading a line on a chart — you're trading a zone where real capital is resting. The moment you internalize that, every order block trade becomes a probability assessment rather than a pattern-matching exercise.
Trading Order Blocks: Entries, Stops, and Targets
Knowing how to identify order blocks is one thing. Trading them profitably is another. Here's the structured approach.
Entry Strategy
The core principle is simple: wait for price to return to the order block zone, then look for confirmation. Never enter blindly when price first touches the zone. Confirmation is what separates high-probability entries from hope-based entries.
Confirmation signals to look for:
- Rejection candle: A long-wicked candle that enters the OB zone and closes back outside it, indicating that the resting orders absorbed the incoming pressure.
- Lower timeframe BOS: Drop to a lower timeframe (e.g., from 1H to 5M) and wait for a break of structure in the direction of your trade. This is the strongest form of confirmation because it shows the institutional orders have actually engaged.
- Fair Value Gap fill into the OB: If price retraces through an FVG and reaches the order block, you have confluence — two SMC concepts aligning at the same price zone.
- Shift in order flow: For traders using footprint or order flow data, a visible absorption pattern within the OB zone adds an additional layer of institutional confirmation.
Stop Loss Placement
Your stop loss goes beyond the order block zone — not at the edge of it, but past it with a small buffer. For a bullish order block, your stop sits below the low of the OB candle. For a bearish order block, it sits above the high of the OB candle.
The logic: if price fully trades through the order block, those institutional orders have been consumed or the thesis is invalidated. There's no point holding a position based on a zone that has been completely broken.
Take Profit Targets
Target the opposite side of the market structure:
- Opposing liquidity: If you're long from a bullish OB, target the buy-side liquidity resting above the nearest swing high. Price is attracted to liquidity pools.
- Next structural level: Target the next significant order block or point of interest on the opposite side. This is where institutions on the other side of the trade have their positions.
- Imbalance fill: If there's a Fair Value Gap above your entry (for longs), price is likely to fill it — use the top of the FVG as a conservative target.
Risk-to-Reward Reality Check
A well-identified order block with proper confirmation typically offers 3:1 to 5:1 risk-to-reward. If your setup doesn't offer at least 2:1, either your stop is too wide (you're using the wrong OB) or your target is too conservative. Tight OB zones with clear opposing liquidity targets are where the highest R:R setups live.
Common Mistakes Traders Make with Order Blocks
Order blocks are straightforward in theory but brutal in practice if you skip the details. Here are the mistakes that cost traders the most.
Mistake 1: Trading Every Order Block
The most common error by far. Not every opposite-color candle before a move is a tradeable order block. The move must break structure. Without a BOS, you're trading random candles, not institutional footprints. Apply the filters: BOS, displacement, higher timeframe alignment. If any one of these is missing, pass on the trade.
Mistake 2: Ignoring Higher Timeframe Context
A beautiful bullish order block on the 5-minute chart is worthless if the 4-hour chart is in a confirmed bearish trend with price sitting inside a bearish order block. The higher timeframe always wins. Your lower timeframe OB is an entry mechanism within the higher timeframe's directional bias — never a standalone trade idea.
Mistake 3: Not Waiting for Confirmation
Setting a limit order at the top of an order block and walking away is gambling, not trading. Price can wick through the entire OB zone and keep going. Always wait for a reaction — a rejection wick, a lower timeframe break of structure, or at minimum a shift in candle character. The few pips you "lose" by waiting for confirmation are insurance against the setups that don't work.
Mistake 4: Treating Order Blocks as Guaranteed Reversals
Order blocks increase the probability of a reaction — they don't guarantee one. Markets change, institutions adjust their positions, and some OBs get run through entirely. If you treat every order block like a guaranteed reversal zone, you'll blow through your risk management the first time the market doesn't cooperate. Every OB trade is a probability play, and you size your positions accordingly.
Mistake 5: Using Mitigated Order Blocks
Once price has returned to an order block and reacted from it, the institutional orders in that zone have been partially or fully filled. Trading the same OB a second or third time drastically reduces your edge. Always prioritize fresh, unmitigated order blocks. If an OB has already been tapped, mark it as used and move on.
Manual vs. Automated Order Block Detection
You now have the complete framework for identifying and trading order blocks. The question becomes: how do you want to spend your time — manually scanning every chart and drawing every zone, or having it done for you in real time?
| Criteria | Manual Detection | GOAT Toolkit (Automated) |
|---|---|---|
| Speed | 10-15 min per chart, per timeframe | Instant — real-time detection |
| Consistency | Varies with fatigue, mood, bias | Same algorithm, every candle, every time |
| Multi-timeframe | Requires switching between charts | Considers HTF structure automatically |
| BOS validation | Manual swing point identification | Algorithmic structure break detection |
| Displacement check | Subjective visual assessment | Quantified momentum measurement |
| Mitigation tracking | Must remember and manually update | Auto-tracks mitigated vs. unmitigated |
| Integration | Standalone analysis | OBs feed into composite 0-100 score |
| Human bias | Confirmation bias affects marking | Zero emotional interference |
Here's the reality: you just learned exactly how order blocks work. You understand the theory, the structure, the validation criteria, and the trading mechanics. You could spend the next hour manually marking order blocks across six charts and three timeframes, checking each one against the criteria you've learned here.
Or you could open a chart and have every valid order block already marked for you — structure breaks labeled, displacement measured, mitigated zones grayed out — all feeding into a composite score that tells you exactly how strong the setup is from 0 to 100.
That's what the GOAT Toolkit does. It runs the same framework you just learned, but it does it on every candle, across every timeframe, in real time. No zones to draw. No structure to manually track. Just the high-probability setups, already identified and scored.
See It In Action
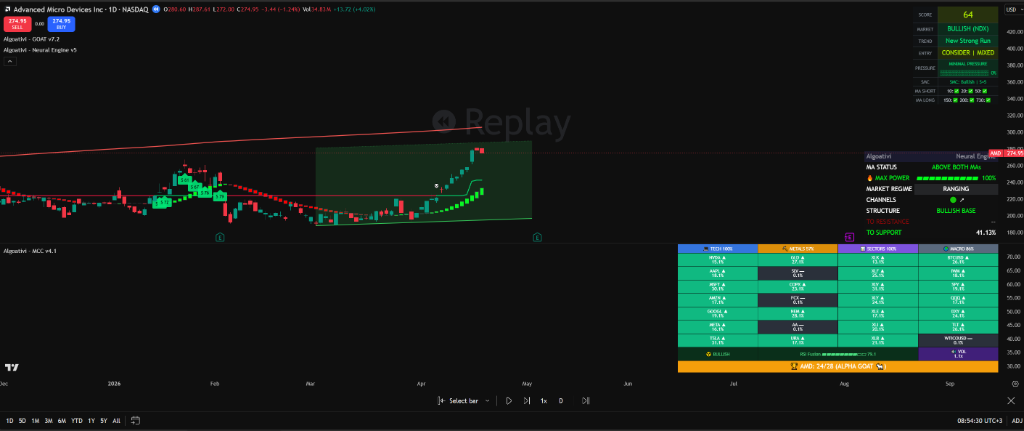
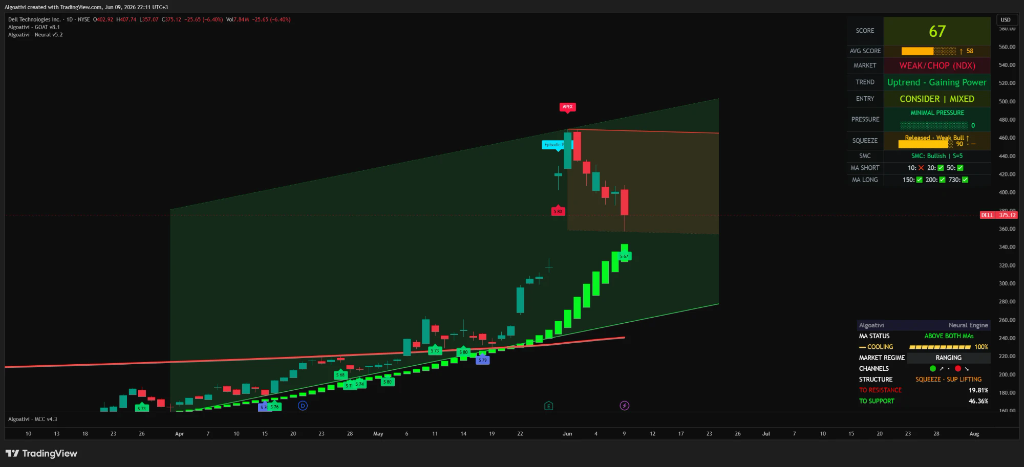
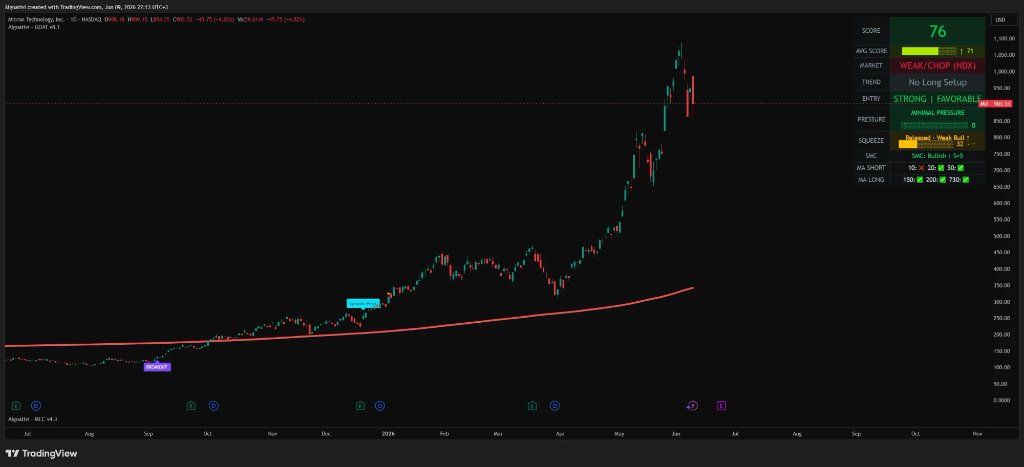
The GOAT Toolkit detects Order Blocks automatically as part of its Smart Money Concepts engine.
See them on your chart — 7 days free. No credit card required.
Start Free TrialFrequently Asked Questions
Do order blocks work on all timeframes?
Yes, order blocks form on every timeframe from the 1-minute to the monthly chart. However, higher timeframe order blocks (4H, Daily, Weekly) carry significantly more weight because they represent larger institutional positions with more unfilled orders. Lower timeframe OBs are best used as precision entry points within the context of a higher timeframe directional bias. A 15-minute OB inside a Daily OB is a high-probability confluence setup. A 15-minute OB on its own is considerably weaker.
Are order blocks the same as supply and demand zones?
They share the same underlying concept — zones where significant buying or selling occurred — but order blocks are more precisely defined. Supply and demand zones are typically drawn around entire consolidation ranges, which can be wide and ambiguous. Order blocks narrow the zone to a specific candle: the last opposite-color candle before the impulsive move. This precision gives you tighter stop losses and better risk-to-reward ratios. Additionally, valid order blocks require a break of structure confirmation, which supply/demand zones do not.
Do order blocks repaint?
In manual analysis, order blocks don't "repaint" because you're marking historical candles that have already closed. With automated tools, it depends on the implementation. Some low-quality indicators mark potential OBs in real time before the structure break is confirmed, then remove them if the break doesn't happen — that's repainting. The GOAT Toolkit only marks order blocks after the structure break and displacement are confirmed on a closed candle, so the zones don't repaint once drawn.
What's the difference between an order block and a support/resistance level?
Traditional support and resistance levels are horizontal lines drawn at prices where bounces occurred historically. They describe what happened but not why. Order blocks explain the why: institutional orders resting at a specific zone. Support/resistance is a line; an order block is a defined zone with a specific candle origin. Order blocks also have an expiration — once mitigated, they lose their effectiveness — while traditional S/R levels are often redrawn indefinitely. The practical difference: OBs give you tighter, more actionable zones with built-in invalidation criteria.
How many order blocks should I track at once?
On any single chart, track no more than 2-3 unmitigated order blocks per direction. Stacking ten OBs on a chart creates visual noise and analysis paralysis. Focus on the most recent, most clearly defined, and most structurally significant ones. If you're trading multiple instruments, keep it even simpler: the single highest-probability OB per asset, per direction, aligned with the HTF bias. Quality beats quantity every time.
Can I use order blocks with other indicators?
Absolutely — and you should. Order blocks are strongest when combined with other Smart Money Concepts like Fair Value Gaps, break of structure, and liquidity sweeps. Using OBs with volume analysis, relative strength tools, or trend confirmation indicators adds further conviction. The GOAT Toolkit is designed around this principle: order blocks are one input in a composite scoring system that weighs structure, momentum, volume, and SMC concepts together to produce a single 0-100 score per asset.
Order blocks detected. Fair Value Gaps marked.
Structure breaks labeled. All automatic.
7-day free trial. No credit card required.
Start Your Free Trial