Stop Guessing — Use TradingView Bar Replay to See Exactly How Our Indicators Work
You added the indicators. You see some signals on the chart. But you're staring at a static screenshot of today — and thinking: "Would this have actually caught that move last month?"
There's a way to find out. Right now. For free.
TradingView Bar Replay: Your Trading Time Machine
Bar Replay is a built-in TradingView feature that does something deceptively simple:
It rewinds your chart to any historical date, hides the future, and lets you press Play — watching each candle appear one at a time, with all your indicators recalculating live.
No hindsight. No cherry-picked screenshots. Just you, the chart, and the signals — unfolding exactly as they would have in real time.
Every GOAT Score shift. Every Neural Channel expansion. Every Exit Pressure spike. You see it when it happens — not after.
This is the single fastest way to build trust in any indicator system.
How to Set It Up (5 Minutes)
🎯 Step 1 — Load Your Chart
Open any ticker on TradingView. Add the three GOAT indicators:
- GOAT Toolkit v7 — the 0–100 score, SMC overlay, Exit Pressure
- Neural Engine v4 — Neural Channel, automated trendlines
- Macro Command Center — relative strength scanner
Use the Daily timeframe. One bar = one trading day. Easy pace for learning.
⏪ Step 2 — Hit the Replay Button
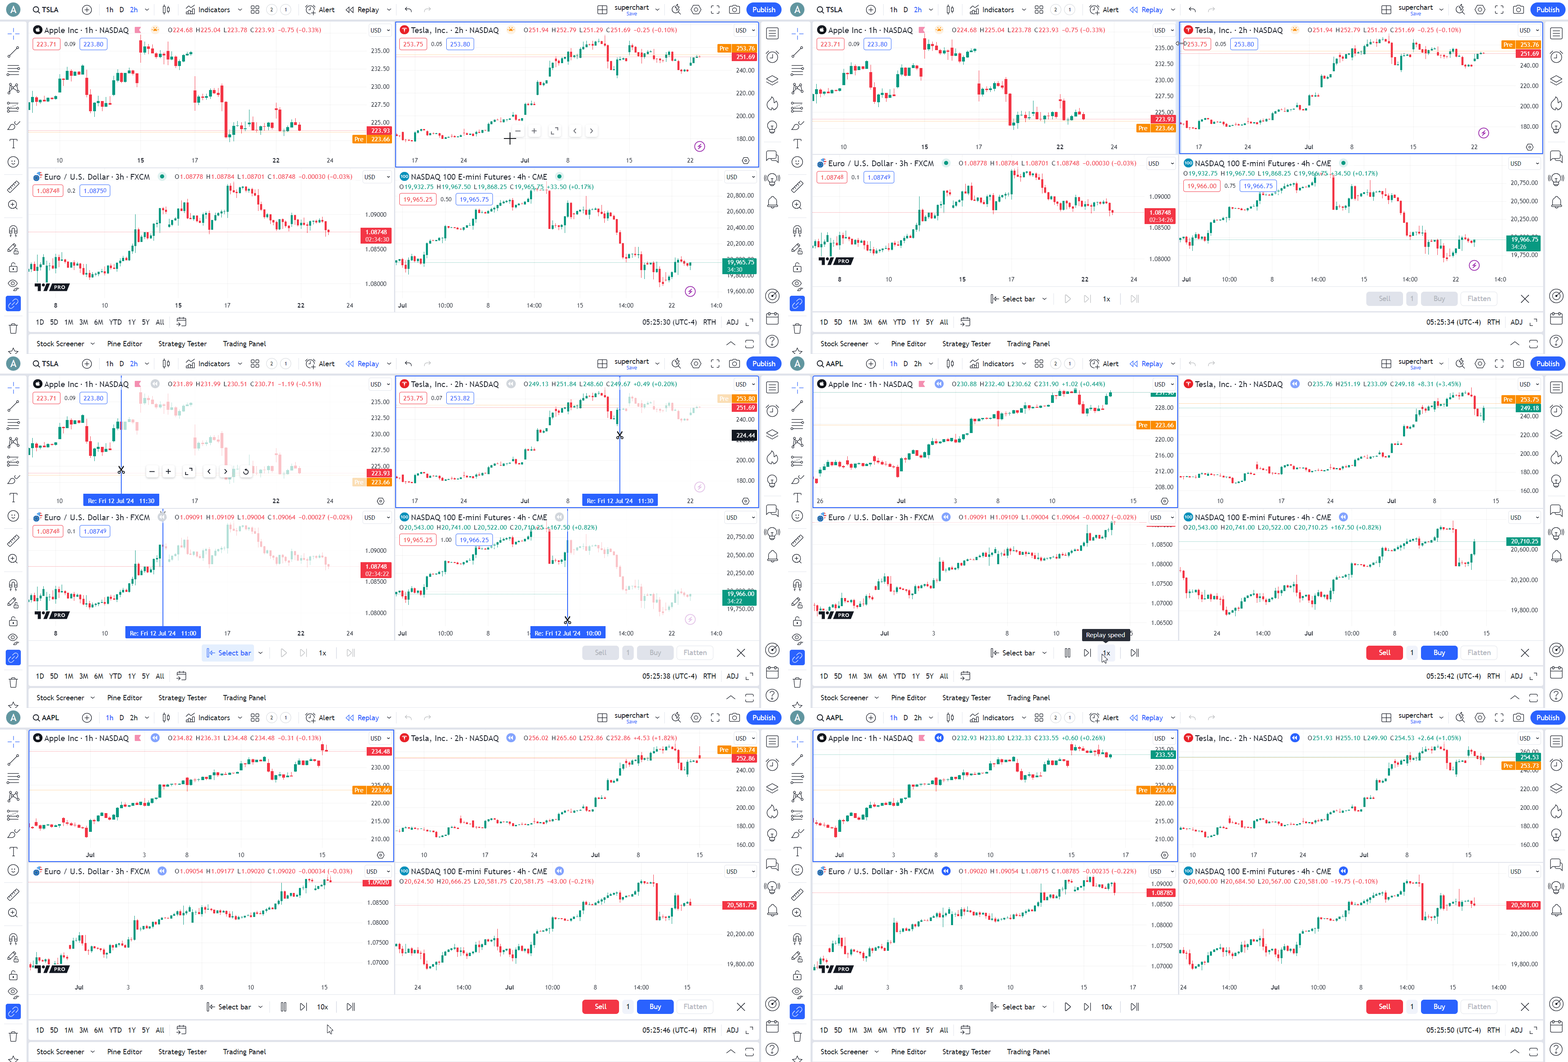
Look at TradingView's top toolbar. Click the Bar Replay button (backward-arrow icon, next to the camera).
A control panel appears at the bottom — Play, Pause, Forward, speed slider. Like a video player for your chart.
✂️ Step 3 — Pick a Start Date
Your cursor becomes a blue line with scissors. Click anywhere on the chart to set your starting point.
Everything to the right vanishes. You're now looking at the chart as it existed on that date.
Best starting points to try first:
- Right before a big rally you remember — watch the GOAT Score climb from 30 → 70+
- Before a selloff — see Exit Pressure scream before the drop hits
- A boring, choppy week — watch the score sit at 45 and keep you out of garbage trades
▶️ Step 4 — Press Play
Hit Play. Watch candles appear one at a time. Watch the indicators react.
That's it. That's the whole trick.
You'll see the GOAT Score update. Smart Money Concepts drawing new Order Blocks. The Neural Channel expanding or compressing. Exit Pressure rising before reversals.
30 minutes of replay teaches more than 30 hours of reading.
⏹️ Step 5 — Return to Live
Click "Jump to real-time chart" to go back to live data. Any drawings you made during replay stay on the chart.
5 Exercises That Actually Build Skill
Don't just press Play and zone out. Try these:
1. The Score Build-Up
Find a period where GOAT Score went from sub-30 to 70+. Replay it. Watch what happens first — the score, the channel, or the SMC signal? Understanding the sequence changes how you read charts forever.
2. The Trap
Find a ticker that looked bullish but dumped. Replay and ask: which Trinity checkpoint failed? Did Exit Pressure warn you? Did the Weekly show a Death Cross the Daily couldn't see? This is where you learn when NOT to trade.
3. The Chop Filter
Replay through a boring, sideways week. Watch the GOAT Score sit between 40–60 the entire time. This is the system protecting you. The best trade is often the one you don't take.
4. Daily vs. Weekly Side-by-Side
Open a Daily + Weekly chart layout. Enable replay on "All charts" mode. Watch both timeframes advance together — this is the Trinity Protocol's dual-phase validation happening live.
5. Three-Ticker Showdown
Open three charts: one trending hard, one choppy, one bearish. Run replay on all three simultaneously. The visual contrast between an all-green Trinity screen and a failing setup is something no tutorial can replicate.
Quick Reference: What to Watch For
| Signal | What It Means | Look For |
|---|---|---|
| GOAT Score → 60+ | Conditions turning favorable | Is the score accelerating or stalling? |
| GOAT Score < 40 | Stay out | How often it saves you from whipsaws |
| Exit Pressure spike | Selling pressure building | How much warning you get before the drop |
| Neural Channel touch | Sniper entry zone | Bounces vs. breakdowns at the channel edge |
| New Order Block | Institutional zone forming | Which blocks hold and which get swept |
| MCC "Strong" rank | Relative strength leader | Whether top-ranked assets actually outperform |
Good to Know
- Alerts don't fire in replay mode — they keep running on live data in the background
- Paper trading still uses real-time prices, not replay data
- Works with standard chart types only — not Renko, P&F, or tick charts
- Drawings made during replay stay on your chart after you exit
- Multi-chart layouts can sync replay across all charts using "All charts" mode
Why This Beats Traditional Backtesting
A backtest gives you a number. "+12% over 6 months." Cool.
Bar Replay gives you the experience.
You feel the uncertainty when the score hovers at 58 — is it going to break 60 or fade? You feel the relief when Exit Pressure fires two bars before a -4% candle. You feel the discipline of sitting out when everything looks flat and boring.
That's not data. That's conviction. And conviction is what keeps you in a trade when everyone else panic-sells.
Try It Yourself — Free for 7 Days
Full access to all three indicators. No credit card. Load them up, hit Replay, and see what the fuss is about.
No card required · Cancel anytime · Works on stocks, crypto, forex & commodities