The 730 MA — How One Line Separates Secular Bulls from Secular Bears
By AlgoatTV · April 11, 2026 · 22 min read
Every trader knows the 50 MA and the 200 MA. Golden Cross. Death Cross. “Price above the 200 means bullish.”
You’ve heard it a thousand times.
But none of them answer the only question that matters.
Which era are you in?
The 730-period SMA (Simple Moving Average) compresses two full years of price data into a single line. It doesn’t tell you what’s happening this week — it tells you what macro era you’re in. Secular Bull or Secular Bear. That distinction changes everything about how you trade: which dips to buy, which rallies to sell, and which setups to avoid entirely. This guide breaks it down with two live examples from April 2026 — one stock in a secular bear that collapsed 60%+, and one in a secular bull that rallied 800%.
IN THIS GUIDE
What Is the 730 MA?
The 730-period Simple Moving Average is the average closing price of the last 730 trading days — roughly two full years of market data compressed into a single line on your chart.
Most traders never look at it. The 50 MA is fast enough to show momentum. The 200 MA is slow enough to define the “trend.” Why would you need something that looks back two years?
Because the 50 and the 200 tell you about the wave. The 730 tells you about the ocean.
THINK OF IT THIS WAY
A surfer reads waves. But a sailor reads the tide. If the tide is going out, it doesn’t matter how good the wave looks — you’re fighting the current. The 730 MA is the tide chart. It tells you whether the ocean itself is rising or falling. Every other indicator you use operates inside that reality — whether you know it or not.
Secular vs. Cyclical Trends — Why It Matters
Most traders think in one dimension: bullish or bearish. But the market operates in two layers:
Cyclical Trends
Weeks to months. Measured by the 50 MA, 200 MA, and standard momentum indicators. This is where most traders live.
A stock can be in a cyclical uptrend (bouncing, making higher lows) while simultaneously being in a secular downtrend (each bounce is lower than the last, grinding toward zero).
Secular Trends
Months to years. Measured by the 730 MA. This is the structural reality that cyclical trends operate inside.
A secular bull means the multi-year trend is up. Dips get bought. Pullbacks are shallow. The gravity pulls price higher. A secular bear means the opposite. Rallies get sold. Each bounce is weaker. Gravity pulls down.
⚠ THE MISTAKE 90% OF TRADERS MAKE
They see a “dip” and buy it without asking which era the asset is in. A dip in a secular bull is a gift. A dip in a secular bear is a trap. Same price action. Completely different outcome. The only difference is one line — the 730.
Why the 200 MA Isn’t Enough
The 200-day moving average is the industry standard for defining “the trend.” But it has a critical flaw: it’s too responsive to cyclical noise.
A stock can cross above and below the 200 MA multiple times during a single year — generating false signals, whipsaws, and confusion. Each cross triggers a “Golden Cross!” or “Death Cross!” headline. Traders react. Then price reverses. Then it crosses again. The 200 MA becomes a revolving door.
The 730 MA doesn’t whipsaw. It moves so slowly that a genuine cross is a structural event — it happens maybe once every few years. When price crosses the 730, it’s not a signal. It’s a verdict. The era changed.
How to Read the 730 MA
There are only four states. That’s the beauty of it — no interpretation needed.
No oscillators. No divergences. No “it depends on the timeframe.” Price is either above the line or below it. The line is either rising or falling. Four states. Two eras. One truth.
SEE THE 730 ON YOUR CHART
The GOAT Toolkit includes the 730 MA as the 7th MA in the suite.
It auto-labels Secular Bull Era and Secular Bear Era on every chart. 7-day free trial. No credit card.
See Your Era →Case Study: WIX — Secular Bear Era
Score: 0 · Bear Breakdown · 0/28 Relative Strength · Below 730 MA
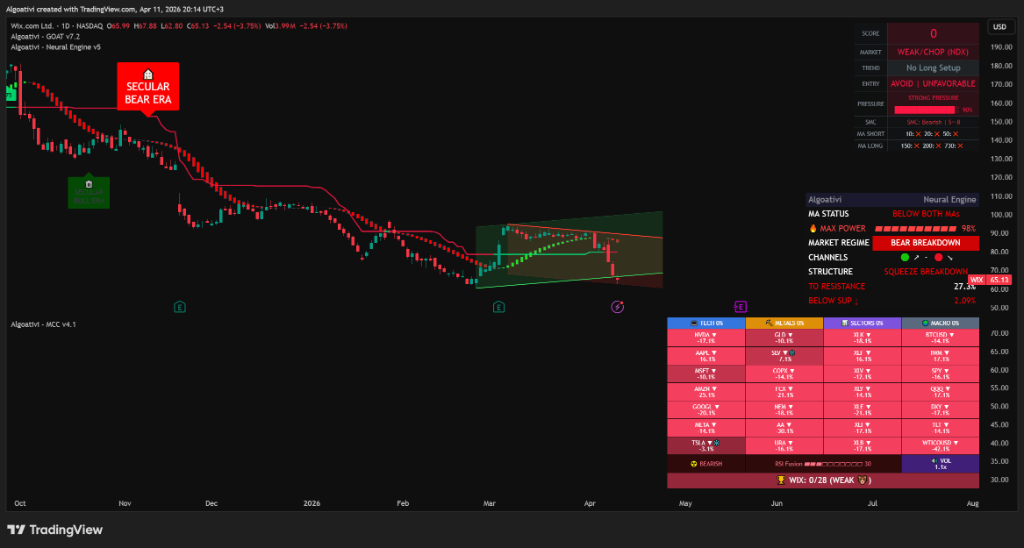
WIX.com, the website builder company, is a textbook secular bear. Price broke below the 730 MA months ago and has been accelerating away from it. The red line on the chart isn’t support — it’s a ceiling getting further away every day.
Look at the full Trinity Protocol reading:
GOAT Score: 0
Every momentum, volume, and trend metric is bearish. Absolute floor.
Entry: AVOID | UNFAVORABLE
The system isn’t ambiguous. Zero setup quality.
Exit Pressure: STRONG
Selling intensity hasn’t let up. The gauges are buried.
MCC Reactor: 0/28 (WEAK)
Dead last against all 28 tracked assets. Absolute bottom of relative strength.
Neural Engine: BEAR BREAKDOWN
Squeeze resolved downward. Structure: Squeeze Breakdown.
MA Status: Below BOTH MAs
Price under every short and long-term average. 730 is above and falling.
THE NEWS CONFIRMED WHAT THE LINE ALREADY SAID
• Analyst downgrade to “Market Perform” — the stock plunged 23% in one week
• Core business revenue growth decelerating
• AI is building websites now — every major LLM can replicate WIX’s core product
• They bought back 30% of their own shares for $1.6B — didn’t stop the bleeding
You didn’t need any of those headlines. The 730 told you the story months ago.
The lesson: Every rally inside a secular bear is a trap until the 730 gets reclaimed. If you’re buying WIX dips right now, you’re not buying a dip — you’re catching a knife in a falling ocean. The tide is out. The 730 told you.
Case Study: WDC — Secular Bull Era
Score: 52 · Bullish Base · Max Power Momentum · Above 730 MA · +800%
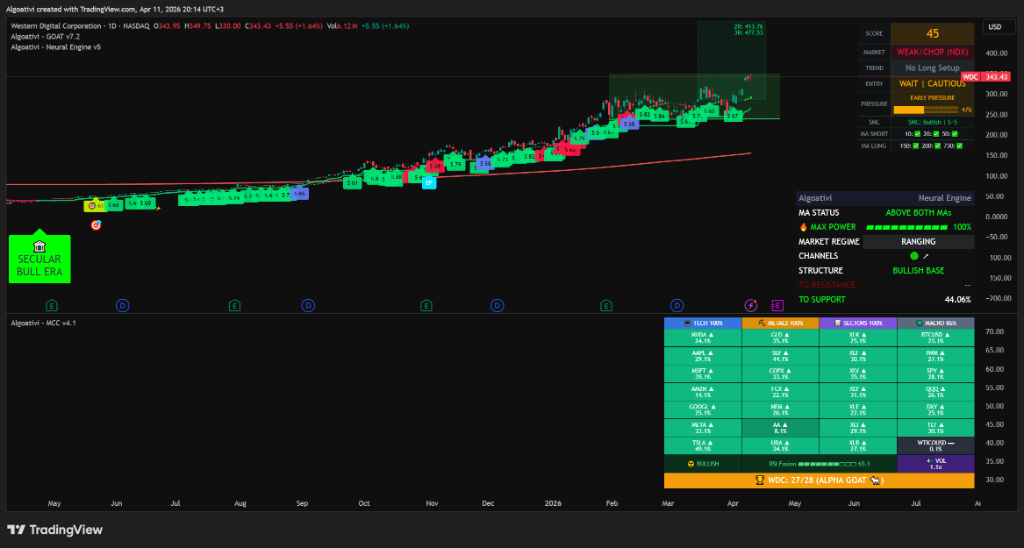
Now look at the opposite. Western Digital crossed above its 730 MA earlier this year. The label on the chart reads: Secular Bull Era.
The number on the chart: +800% from the secular bottom. Not +8%. Not +80%. Eight hundred percent. From $38 to $340+.
GOAT Score: 52
Pulled back from the 80-90s during the run. Currently in a consolidation — not a breakdown.
MA Status: ABOVE BOTH MAs
Price is above every MA in the suite. The 730 is below, rising, acting as a structural floor.
Momentum: MAX POWER (100%)
The Neural Engine’s 10-stage momentum system is fully charged.
Structure: BULLISH BASE
Ranging after a massive run — building a base for the next leg, not topping.
THE FUNDAMENTALS FOLLOW THE LINE
• AI demand for storage is exploding — WDC has sold out HDD capacity for all of 2026
• Revenue up 25% YoY, EPS up 78%
• Analysts have “Strong Buy” consensus — price targets up to $440
• Stock has climbed 560% in the last 52 weeks
Again — the 730 told you the era changed before any of these headlines were written. The line leads. The narrative follows.
The lesson: Every dip inside a secular bull is a buying opportunity until the 730 gets broken. If you’re buying WDC pullbacks, you’re buying inside a rising ocean. The 730 is your structural floor. The gravity is on your side.
Same Action, Different Outcome
This is the part most traders never internalize. Two traders take the exact same action — “buy the dip” — on two different stocks, in the same week, in the same market. One makes money. One loses money. The only difference between them is one line.
The punchline: The most important decision in trading isn’t your entry trigger. It’s whether you’re swimming with the tide or against it. One line answers that question. Everything else is noise.
How the GOAT Toolkit Uses the 730 MA
The 730 isn’t just a line you eyeball. It’s integrated into the composite scoring system and the macro layer of the Trinity Protocol:
The MA Suite (7 layers)
The GOAT Toolkit tracks 7 moving averages: 10, 20, 50, 100, 150, 200, and 730. The score checks how many the price is above. All 7 green = maximum trend strength. The 730 is the final, heaviest filter.
Secular Era Label
When the Toolkit detects price above a rising 730, it labels the chart Secular Bull Era. Below a falling 730 = Secular Bear Era. The label appears directly on the chart — no guessing.
Scanner Integration
The weekly Bulls & Bears scanner checks secular trend as part of the ranking algorithm. An asset in a secular bull with a high GOAT Score gets prioritized over one with a high score but a secular bear backdrop. The 730 is a macro filter on every scan.
⚙️ HOW TO ENABLE ERA SIGNALS
The GOAT Toolkit loads in Lite mode by default (Score Table Only) to keep your chart clean. To see the Secular Era labels on your chart:
Open indicator settings (gear icon on the GOAT Toolkit)
Change Chart Display Mode from “Lite: Score Table Only” to “Full Mode”
Scroll to ERA SIGNALS (MA CROSSES) section
Check “Show 730 SMA Era Signals” — the Secular Bull / Secular Bear labels will appear on your chart
You can also enable 150 and 200 SMA Era Signals for intermediate-term crosses. The 730 is the one that defines the secular era.
Frequently Asked Questions
Which era is your chart in?
The 730 answers in one glance.
7 moving averages. Secular era labels. Composite scoring. All on one overlay.
See Your Era — 7 Days Free →No credit card. Full access. All features. Cancel anytime.
RELATED
Six Indicators Conflicting — There’s a Better Way →
REFERENCE
All 3 Indicators Explained →
TRY IT
Ask AI Quant Which Era You’re In →
⚠ NFA — Not financial advice. Algoat.TV provides educational and analytical tools only. All trading decisions are yours. Trading involves risk of loss. Past performance does not guarantee future results.