No-Repaint Indicators: Verify Signals | AlgoatTV
The indicator showed a perfect buy signal. You entered. Then you scrolled back on the chart — and the signal was gone. It moved. It changed history. Your "proof" that the system worked was a lie your chart told you after the fact. That's called repainting. And it's the most common scam in the TradingView indicator space.
Repainting indicators poison everything they touch. Your backtests become fiction. Your confidence becomes misplaced. Your trade journal becomes a record of signals that never actually existed when you needed them. And the worst part: you can scroll through years of chart history and the indicator looks absolutely flawless — every signal perfectly timed, every reversal nailed — because it rewrote itself using data that wasn't available at the time.
This guide explains exactly what repainting is, why it destroys trading accounts, how to test any indicator for it, and what "no repaint" actually means at the Pine Script engineering level. If you trade with TradingView indicators — free or paid — this is required reading before you trust a single signal.
A repainting indicator changes its historical signals after the fact — a buy signal that appeared on a past candle may disappear or move once new data arrives. A non-repainting indicator locks its signals the moment the candle closes. What you see in history is what was actually shown in real-time. To verify, screenshot a signal, wait 5–10 bars, and check whether it moved. Or use TradingView's Bar Replay feature for faster testing.
Table of Contents
What Is Repainting?
Repainting is when an indicator changes its past values or signals after the bar has already closed. The signal was there. You saw it. You acted on it. Then later — maybe 5 bars later, maybe 50 — you scroll back and it's gone. Or it moved to a different candle. Or the value changed entirely.
To understand why this happens, you need to understand how TradingView indicators calculate. Every indicator takes price data as input (open, high, low, close, volume) and runs calculations to produce an output (a line, a signal, a label, a color). The critical question is: which data does it use?
A non-repainting indicator uses only confirmed data — price bars that have already closed. When the current candle is still forming (the "live" bar), any values the indicator calculates are provisional. Once the candle closes, the value locks. It never changes again. The calculation uses data from bar 0 (current closed bar) and earlier. It never reaches forward into bar +1, +2, or +3.
A repainting indicator breaks this rule. It might recalculate the value of bar 10 using data from bar 15. It might use the close of a future candle to decide what signal to show on a past candle. It might run a smoothing algorithm that shifts its entire curve every time new data arrives.
The Before/After Problem
This is the core deception. Load a repainting indicator on a historical chart and it looks like a fortune-teller. Every buy signal sits at the exact bottom. Every sell signal sits at the exact top. The win rate appears to be 85%, 90%, even 95%. But this is an illusion. The indicator placed those signals retroactively using data that didn't exist when the trade would have been taken. In real-time, the signal was somewhere else entirely — or it didn't exist at all. The backtest is perfect because the indicator cheated.
Here's a concrete example. Imagine an oscillator that shows a "Buy" label when it detects a momentum reversal. In real-time on Tuesday, the oscillator is sitting at 35. No signal. Price drops on Wednesday to a new low. On Thursday, price bounces hard. The oscillator recalculates and now shows a "Buy" label on Tuesday — retroactively marking the bottom. If you scroll through the chart on Thursday, it looks like the indicator called the exact reversal. But on Tuesday, when you actually needed the signal, it wasn't there.
That's repainting. The chart becomes a historical novel where the author already knows the ending. It's useless for the only thing that matters in trading: making decisions in real-time with incomplete information.
Why Repainting Is Dangerous
Repainting doesn't just produce bad signals. It corrupts the entire foundation of your trading process. Here's how.
False Backtest Confidence
You run a repainting indicator across 3 years of chart data. It shows a 90% win rate and a 3:1 reward-to-risk ratio. You build your entire strategy around these numbers. You allocate capital based on them. You tell yourself you have edge. But those numbers are fabricated. The indicator used future data to generate those historical results. When you trade it live, the actual win rate is 40–50%. The 3:1 ratio collapses because the real entries are nowhere near where the backtest shows them. You've built a house on sand, and you don't discover it until you're already losing money.
Untraceable Failures
When a trade fails and you go back to review what happened, the signal has changed. The indicator now shows a different reading for that bar. You can't diagnose the problem because the evidence has been altered. Did you misread the signal? Did you enter too early? Did the market conditions not match? You have no way to know because the indicator rewrote its own history. Your trade journal becomes useless. Your review process becomes guesswork. You can't improve what you can't measure, and you can't measure what keeps changing.
Psychological Damage
This is the most insidious effect. You take a trade based on a signal. It loses. You scroll back and the signal is gone. So you blame yourself: "I must have misread it." You take another trade. It loses. The signal vanishes again. You start doubting your own perception. You hesitate on the next signal because you can't trust what you're seeing. The indicator is gaslighting you. You think the problem is your execution, your discipline, your psychology — when the actual problem is that the tool itself is lying to you.
Strategy Corruption
Traders optimize their strategies against repainted signals. They calibrate position sizing, entry rules, stop-loss placement, and profit targets using historical data that never existed in real-time. Every parameter is fitted to a fantasy. When they go live, nothing works as expected. They tweak the strategy. It still doesn't work. They add filters. Still nothing. The feedback loop is broken at the source because every optimization iteration is based on repainted data. You're trying to solve a puzzle with pieces from a different box.
The Real Cost
A trader who uses a repainting indicator for 6 months will typically burn through 2–3 strategies, second-guess dozens of valid trades, and attribute every failure to personal discipline rather than a broken tool. The financial cost is significant. The time cost is worse. Months of screen time, journaling, and backtesting — all built on fabricated data. The fix isn't better discipline. The fix is a non-repainting indicator.
Types of Repainting
Not all repainting is created equal. Some forms are outright deceptive. One form is actually normal and acceptable. Understanding the differences is critical for evaluating any indicator you encounter.
| Type | What Happens | Example | Verdict |
|---|---|---|---|
| Full Repaint | Signals appear and disappear entirely on past bars. A buy arrow that existed yesterday is gone today. | Zigzag indicator places arrows at swing highs/lows retroactively after the next swing is confirmed. | Dangerous |
| Partial Repaint | Signals shift position by 1–3 candles. The signal was on bar 15, now it's on bar 13. | A smoothed oscillator that uses centered moving averages — each new bar shifts the curve for the last few bars. | Misleading |
| Lookahead Bias | Uses future candle data in current bar calculations. The formula for bar 10 includes the close of bar 12. | An indicator using request.security() with lookahead=barmerge.lookahead_on to access future higher-timeframe closes. |
Dangerous |
| End-of-Bar Recalculation | Value changes during the current live bar but locks permanently when the bar closes. No historical bars are ever altered. | An RSI reading that fluctuates as the current candle forms, then locks at 67.3 when the candle closes. The 67.3 never changes. | Normal & Acceptable |
Understanding End-of-Bar Recalculation
End-of-bar recalculation is how every honest indicator works. While the current candle is still forming, the indicator updates its value tick by tick — the close hasn't been determined yet, so the calculation is provisional. This is not repainting. It's real-time calculation. The defining characteristic of a non-repainting indicator is that once a bar closes, its values are permanent. The live bar fluctuates. Closed bars don't. Any indicator vendor who claims their tool "never changes during the bar" is either lying or using only the previous bar's data (which introduces a one-bar lag). End-of-bar recalculation is the standard for quality indicators.
The first three types — full repaint, partial repaint, and lookahead bias — all share the same fundamental problem: they use data from the future to generate signals in the past. Whether the signal disappears entirely, shifts by two bars, or gets the close price one candle early, the result is the same: the historical chart shows something that was never actionable in real-time.
Lookahead bias is particularly insidious because it's subtle. The indicator doesn't obviously redraw itself. It looks stable on the chart. But the calculations for any given bar include data from bars that hadn't occurred yet at that point in time. The only way to detect it is by understanding the Pine Script code or by rigorous real-time testing — which most traders never do.
How to Test If an Indicator Repaints
You don't need to read Pine Script to test for repainting. You need patience and a method. Here are two approaches: the manual screenshot test and the Bar Replay test.
Method 1: The Screenshot Test (Manual)
Add the indicator to a live chart
Choose a liquid asset on a timeframe you actually trade (15m, 1H, 4H, Daily). Don't use a static chart — you need the market to be open and producing new bars.
Wait for a signal and screenshot it
When the indicator produces a buy/sell signal, label, arrow, or notable value on a closed bar, take a screenshot immediately. Note the exact bar, the exact value, and the bar's timestamp.
Wait 5–10 bars
Let the chart continue forming new candles. Don't touch the indicator settings. Don't change timeframes. Just wait.
Scroll back and compare
Navigate back to the bar you screenshotted. Compare the current indicator reading against your screenshot. Is the signal still there? Is it in the same position? Is the value the same?
Interpret the result
If the signal moved, disappeared, or the value changed — the indicator repaints. If everything is exactly where you screenshotted it — it passed this test. Repeat 3–5 times across different market conditions to be thorough.
Method 2: The Bar Replay Test (Faster)
TradingView's Bar Replay feature lets you simulate real-time price action on historical data. This is the fastest way to test for repainting because you can compress days of waiting into minutes.
Click the Replay button on the TradingView toolbar (or press the shortcut key).
Select a starting point in the past. The chart will hide all future bars.
Step forward one bar at a time. Watch the indicator. When a signal appears on a closed bar, note it.
Continue stepping forward 5–10 more bars. Check whether the previous signal moved, changed, or disappeared.
Repeat across different areas of the chart — trending periods, ranges, volatile spikes, and quiet consolidation. A repainting indicator may only repaint under specific conditions.
Bar Replay Limitation
Bar Replay uses historical OHLC data, so it won't perfectly simulate tick-by-tick intrabar behavior. However, it's excellent for detecting the major types of repainting: full repaints, partial repaints, and most lookahead bias scenarios. For the highest confidence, combine Bar Replay testing with the manual screenshot test on a live chart. If an indicator passes both tests across multiple market conditions, you can trust its signals.
Run the 60-second test on indicators that already pass.
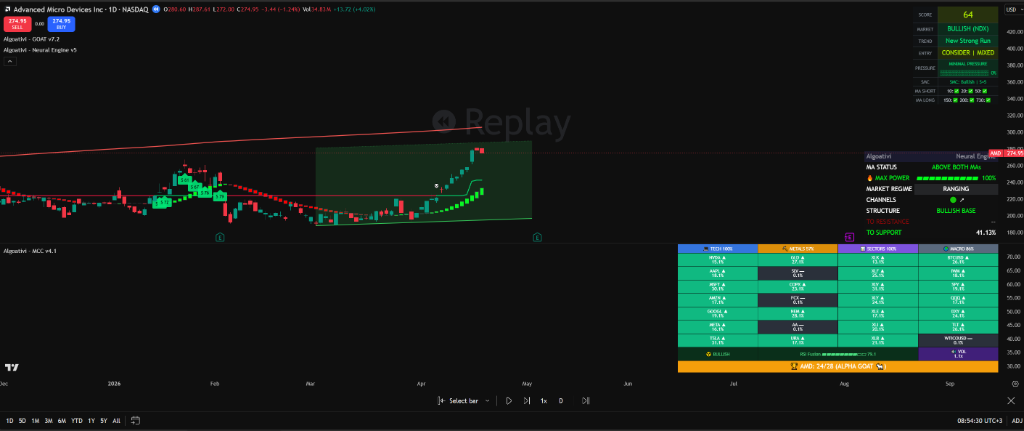
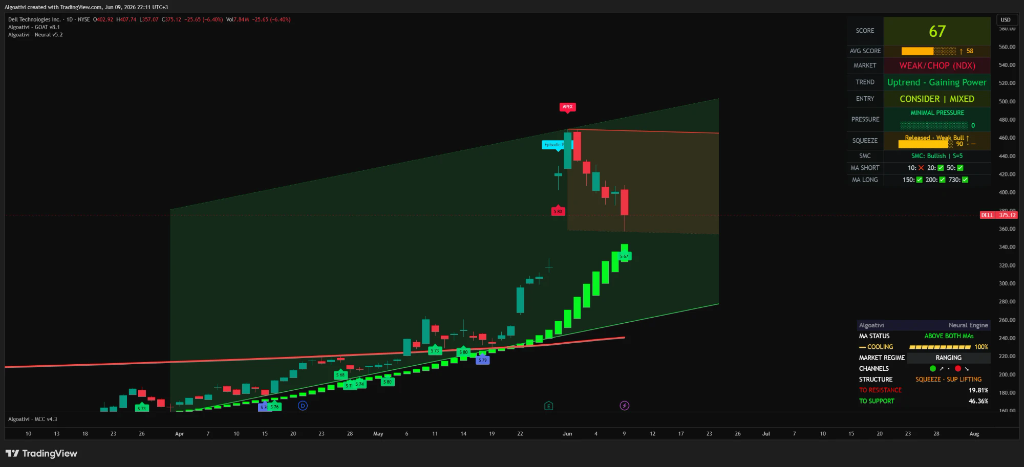
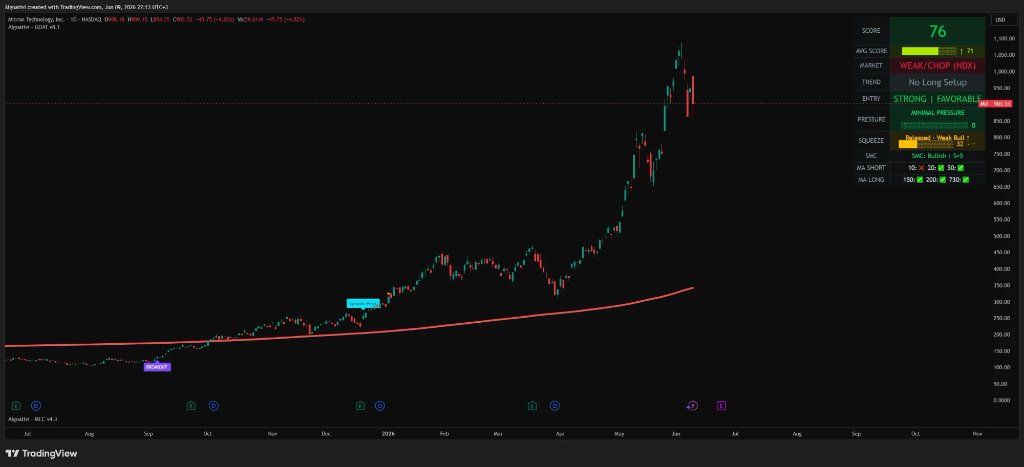
AlgoatTV's 3 indicators are non-repainting by design — every signal locks the moment a candle closes. Load them on TradingView and verify it yourself in under a minute.
Start Free Trial — No Card7 days. Full access. Cancel anytime.
What "No Repaint" Actually Means in Pine Script
If you want to understand the engineering behind a non-repainting indicator — not just the marketing claim — here's what it comes down to at the Pine Script level. You don't need to be a coder to understand these principles.
Principle 1: Calculations Use Only Confirmed (Closed) Bar Data
Every formula in the script references only the current bar's close (after the candle closes) or previous bars. No calculation reaches into future bars. In Pine Script terms, the indicator references close, close[1], close[2] (current bar and older) but never data that would require knowledge of close[-1] or close[-2] (future bars that haven't formed yet).
Principle 2: No Lookahead in Multi-Timeframe Requests
When an indicator pulls data from a higher timeframe (e.g., checking the daily trend on a 1-hour chart), the request.security() function must not use lookahead=barmerge.lookahead_on in a way that accesses future higher-timeframe closes on historical bars. This is one of the most common sources of invisible repainting: the indicator looks correct on the current chart but used the completed daily close value on intraday bars before the day had actually ended.
Principle 3: No Historical Recalculation
Once a bar is closed and the indicator has calculated its value for that bar, the value never changes. The script doesn't go back and update bar 10 when bar 15 completes. This is enforced by the calculation model: Pine Script processes bars sequentially, left to right. A properly written script produces a final value on each bar close and moves on. Algorithms that require backward-looking adjustments (like some implementations of the Zigzag or certain pivot-point calculations) inherently repaint because their definition of a "pivot" depends on what happens after the bar.
Principle 4: Deterministic Output
Given the same input data (the same OHLCV bars), the indicator always produces the same output. No randomness. No dependency on when the chart was loaded. No variation based on the user's timezone or platform. If you load the chart today and again next week, the historical values are identical. This is what separates engineering from marketing. A deterministic indicator is auditable, testable, and reliable. A non-deterministic indicator is a black box that produces different results depending on when you look at it.
These four principles are the technical reality behind the "no repaint" label. Any indicator that satisfies all four is genuinely non-repainting. Any indicator that violates even one of them has a repainting problem — regardless of what the marketing page claims.
All 3 AlgoatTV Indicators Are 100% Non-Repainting
GOAT Toolkit. Neural Engine. MCC Reactor.
Verified on every candle, every timeframe. Deterministic. Auditable. What you see in history is what was shown in real-time — always.
Start Your 7-Day Free TrialHow to Evaluate "No Repaint" Claims
Every indicator on TradingView claims to be the best. Many claim "no repaint." The phrase has become so overused that it's almost meaningless on its own. Here's a checklist to separate genuine engineering claims from marketing noise.
Vendor Evaluation Checklist
Do they show live trading results?
Backtests alone mean nothing with a potentially repainting tool. Look for real-time screenshots, recorded sessions, or live-streamed trades that show the indicator producing signals before the move happens — not after.
Can you verify with Bar Replay?
A vendor confident in their product will encourage you to test it. If they discourage testing, deflect to screenshots of perfect backtests, or offer no trial period — that's a red flag. Test it yourself using the methods described above.
Is the Pine Script source open or invite-only?
Open-source scripts can be audited by anyone. Invite-only (protected) scripts can't be inspected directly, but this doesn't automatically mean they repaint — it means you have to rely on testing and the vendor's transparency. What matters is whether the vendor explains their methodology clearly enough that you understand the logic even without reading the code.
Do they explain their methodology?
A vendor who understands why their indicator doesn't repaint can explain it in plain English. They'll reference confirmed bar data, sequential calculation, and deterministic output. A vendor who can only say "it doesn't repaint, trust us" probably doesn't understand the technical requirements — or doesn't meet them.
Do they offer a free trial?
A free trial gives you time to run the screenshot test and Bar Replay test yourself. If a vendor demands payment before you can even test the indicator on a chart, they're asking you to trust their marketing over your own verification. That's backwards.
Red Flags
"99% accuracy"
No legitimate indicator achieves 99% accuracy in live trading. If historical backtests show this number, the indicator almost certainly repaints.
Backtests only, no live proof
If every screenshot shows a historical chart with perfect signals, ask for one single real-time screenshot. If they can't produce it, you know why.
"Secret algorithm"
Proprietary code is fine. "Secret" with zero explanation of methodology is a smokescreen. Legitimate vendors explain what their tool measures even if the exact code is protected.
No trial period
If you can't test before you pay, ask yourself what they're afraid you'll discover. A non-repainting indicator has nothing to hide from a Bar Replay test.
The core takeaway: "no repaint" is an engineering claim, not a marketing tagline. Treat it like any other technical specification — verify it with testing, understand the methodology behind it, and hold the vendor to the same standard you'd hold any tool that your money depends on.
Frequently Asked Questions
Do all paid indicators repaint?
No. Paid versus free has no correlation with repainting. There are free indicators that don't repaint (a simple SMA crossover, for example) and paid indicators that repaint badly. The price tag tells you nothing about the calculation integrity. What matters is the engineering: does the indicator use only confirmed bar data, avoid lookahead in multi-timeframe requests, and produce deterministic output? That's the standard. You can find it in both free and paid tools — though comprehensive composite indicators that measure trend, momentum, volatility, and volume simultaneously tend to be paid because of the development effort required.
Is end-of-bar recalculation the same as repainting?
No. End-of-bar recalculation means the indicator updates its value on the current live bar as the candle forms, then locks the value permanently once the candle closes. This is standard and expected behavior — the close price isn't known until the bar is complete, so any calculation involving the close will naturally fluctuate during the bar. Repainting means closed bars change their values after the fact. The distinction is simple: if only the current (open) bar's values change, that's normal. If previously closed bars change, that's repainting.
Can an indicator repaint on one timeframe but not another?
Yes, and this is more common than most traders realize. The most frequent cause is improper use of request.security() for multi-timeframe data. An indicator might work perfectly on the daily chart (no higher timeframe calls needed) but repaint on the 15-minute chart because it pulls daily data with lookahead enabled. Another scenario: some algorithms use a fixed lookback period that happens to be long enough on the daily chart to avoid issues but too short on lower timeframes. This is why testing should cover multiple timeframes, not just the one you primarily trade.
Why do vendors sell repainting indicators?
Three reasons. First, some vendors genuinely don't understand what repainting is — they build an indicator, look at the historical chart, see great results, and assume it works. They're fooling themselves before they fool anyone else. Second, some vendors know their indicator repaints and deliberately exploit it: those perfect backtest screenshots are irresistible marketing material. A chart showing 50 consecutive winning trades sells subscriptions. Third, some algorithms are inherently repainting by design (like the Zigzag), and the vendor either doesn't disclose this or misrepresents it as "confirmation-based" signaling. The common thread: always test, never trust screenshots alone.
How does AlgoatTV prevent repainting?
All three AlgoatTV indicators — GOAT Toolkit, Neural Engine, and MCC Reactor — are engineered from the ground up to be 100% non-repainting and deterministic. Every calculation uses only confirmed (closed) bar data. Multi-timeframe requests are handled without lookahead bias. No historical bars are ever recalculated after closing. The output is deterministic: the same input data always produces the same output, regardless of when the chart is loaded. These aren't retroactive claims — they're architectural decisions made at the code level before a single signal is generated. You can verify this yourself using Bar Replay on any timeframe during a free trial.
What's the Bar Replay test?
TradingView's Bar Replay feature lets you "rewind" the chart to any point in history and then step forward bar by bar, simulating real-time price action. To test for repainting: activate Replay, choose a starting point, step forward until the indicator produces a signal on a closed bar, then continue stepping forward 5–10 more bars while watching whether that signal moves, changes, or disappears. If it stays exactly where it was — same bar, same value, same label — the indicator passed. If anything shifted, it repaints. This is faster than the manual screenshot test because you can compress weeks of trading into minutes. Repeat across different market conditions (trending, ranging, volatile) for thorough verification.
Non-Repainting. Deterministic.
Verified on Every Candle.
GOAT Toolkit • Neural Engine • MCC Reactor
What you see in history is what was shown in real-time. Test it yourself — 7-day free trial, no credit card required.
Start Your Free TrialFurther Reading
- Best TradingView Indicators for Beginners: What Actually Works — Pillar Guide
- How to Read TradingView Indicators: The Complete Guide — Cluster Guide
- How to Read Any TradingView Chart in Under 60 Seconds — Pillar Guide