Multi-Timeframe Analysis: Daily + Weekly Without Contradictions
The daily chart says buy. The weekly chart says sell. You freeze.
This happens every day to traders who use multiple timeframes without a framework for resolving conflicts.
You spend 30 minutes switching between charts, each one telling a different story. By the time you decide, the setup is gone. Or worse — you take the trade and immediately discover you were reading the wrong timeframe.
The problem isn't the charts. It's the hierarchy.
What if you had a system that resolves timeframe conflicts in seconds?
Multi-timeframe analysis means reading the same asset on two or more timeframes to confirm or deny a trade setup. The core rule is simple: the higher timeframe sets the directional bias, the lower timeframe finds the entry. Weekly charts tell you which direction to trade. Daily charts tell you when to enter. Intraday charts tell you where to place the trigger. When timeframes agree, probability stacks in your favor. When they conflict, the higher timeframe wins — with a few specific exceptions this guide covers in detail. This is the single most important concept separating traders who fight the trend from traders who ride it.
IN THIS GUIDE
Why One Timeframe Isn't Enough
A daily buy signal inside a weekly downtrend is a trap. Period. This is the single most expensive lesson in technical analysis, and most traders learn it by blowing up an account before they internalize it.
Here's why a single timeframe lies to you. Every chart is a filtered version of reality. A daily chart shows you a 6-month window of candles. It can paint a picture that looks perfectly bullish — higher lows, RSI trending up, MACD crossing bullish, price above the 20 EMA. Every single signal says go long. And you would be wrong. Because if you zoomed out to the weekly chart, you'd see that this entire "bullish setup" is a bear flag forming inside a multi-month distribution pattern. That bullish daily move is a countertrend rally that's about to fail.
This happens constantly. It happens in both directions. A daily chart can look bearish — breaking below support, volume expanding to the downside, indicators rolling over — while the weekly chart shows price pulling back to a major demand zone that has held four times in the past year. That "breakdown" on the daily is a buying opportunity on the weekly. The daily trader shorts. The weekly trader buys. Guess who wins.
The reason this happens is structural, not random. Higher timeframes carry more weight because they represent more capital, more time, and more conviction. A weekly support level has been tested by every participant who was active over the past 5+ months. A daily support level has been tested by participants active over the past few weeks. When these levels collide — when a daily breakdown runs into weekly support — the weekly support wins the majority of the time because the institutional money defending that level dwarfs the retail money trading the daily pattern.
⚠ THE SINGLE-TIMEFRAME TRAP
A daily chart in isolation tells you what price is doing right now. It doesn't tell you what price is doing right now relative to the bigger picture. That context is everything. A candle at a daily resistance looks like a sell signal. The same candle breaking through a weekly breakout level is a momentum buy. Same candle. Completely different meaning. Without the higher timeframe, you're reading words without sentences.
This doesn't mean you need to monitor seven timeframes simultaneously. That's analysis paralysis disguised as thoroughness. The framework is simpler than that: you need a maximum of two to three timeframes, organized in a hierarchy where each one has a specific job. The higher timeframe gives you the direction. The lower timeframe gives you the timing. Everything else is noise.
The traders who consistently make money from multi-timeframe analysis aren't the ones with the most screens or the most charts open. They're the ones with the clearest hierarchy. They know which timeframe is the boss, which one is the employee, and they never let the employee overrule the boss.
The Timeframe Hierarchy
Every timeframe in your analysis needs a defined role. No exceptions. If you can't articulate why you're looking at a specific chart, close it. Here's the hierarchy that institutional traders use, scaled for both swing traders and intraday operators.
Think of it as a chain of command. Each layer filters the next. The monthly chart tells you the macro regime. The weekly chart tells you the trend. The daily chart tells you the setup. The intraday chart tells you the trigger. You never skip a layer. You never let a lower layer override a higher one. And you never trade a trigger that contradicts the trend.
💡 THE 3x RULE
A widely used guideline is the 3x multiplier between analysis timeframes. If your setup chart is the daily, your bias chart should be roughly 3–5x higher (weekly). If your setup chart is the 4H, your bias chart should be the daily. Going beyond a 5x gap between timeframes creates a disconnect where the signals have little practical relationship. A 5-minute chart and a monthly chart are so far apart that alignment is essentially random. Stick to adjacent layers.
The most common multi-timeframe stack for swing traders is Weekly + Daily. It covers 90% of what you need. The weekly tells you whether to look for longs, shorts, or neither. The daily tells you if a setup exists today. If the weekly says bullish and the daily shows a pullback to support with bullish reversal signs, that's a trade. If the weekly says bearish and the daily shows a rally into resistance, that's also a trade — in the short direction.
For traders who want surgical entries, adding the 4H chart as a third layer is the most you should ever need. Weekly for bias, daily for setup, 4H for trigger. Three screens. Three jobs. No overlap.
How to Read Multiple Timeframes: A Step-by-Step Flow
The process is sequential. You start at the top and work down. Every step is a gate — if the current step fails, you skip the trade entirely. You don't try to force alignment. You don't rationalize why the daily might be right even though the weekly disagrees. You move to the next ticker.
Here's the exact workflow. Follow it in this order, every time, for every trade.
Start with the Weekly (or Monthly) for Directional Bias
Open the weekly chart. Ask one question: Is this asset trending up, trending down, or chopping sideways? Don't overthink it. Look at the structure of the last 6–12 months. Higher highs and higher lows = bullish. Lower highs and lower lows = bearish. A mess of overlapping candles with no clear direction = range-bound.
Check where price sits relative to the weekly moving averages (50 and 200 SMA are standard). Check the weekly Ichimoku cloud if you use it. Check whether the weekly trendlines are intact or broken. This step takes 10 seconds.
Output: A one-word bias — BULLISH, BEARISH, or NEUTRAL. This is your compass for the entire analysis.
Use the Daily for Setup Identification
Now drop to the daily chart. But here's the critical constraint: you already know which direction you're looking for. If the weekly is bullish, you're only scanning for long setups on the daily. If the weekly is bearish, you're only scanning for short setups. If the weekly is neutral, you're looking for range-bound plays or you skip the asset entirely.
On the daily, look for actionable patterns: pullbacks to a moving average or trendline, breakouts from consolidation, retests of broken resistance as new support, bullish engulfing candles at demand zones. The specific setup depends on your trading system. What matters is that the setup direction matches your weekly bias.
Output: A specific setup with defined entry zone, stop level, and target. Or no setup — in which case you wait.
Use 4H/1H for Entry Precision (Optional)
This step is optional and depends on how tight you want your entry. If you have a daily setup — say, a pullback to a rising 21 EMA with the weekly trend bullish — you can enter on the daily close itself. Many successful swing traders never go below the daily chart.
But if you want a tighter stop and better risk-reward, drop to the 4H chart and look for a bullish reversal pattern (hammer candle, bullish divergence on RSI, break of a falling trendline) within the daily setup zone. This gives you a more precise entry that can reduce your stop distance by 30–50%, significantly improving your R:R ratio.
Output: A precise entry trigger with a tight stop, nested within the daily setup and weekly bias.
Align or Skip
At any point in this sequence, if the lower timeframe contradicts the higher one, you stop. You don't force it. Weekly says bullish but the daily is showing a clear bearish pattern with expanding sell volume? Skip. Wait for the daily to realign with the weekly bias. Maybe the pullback has further to go. Maybe the weekly trend is starting to roll over. Either way, taking a trade where timeframes disagree is fighting yourself.
The discipline of skipping misaligned setups is where 80% of the edge comes from. Not from the entries you take, but from the bad trades you avoid.
MULTI-TIMEFRAME DECISION FLOW
Weekly Bias?
Bullish / Bearish / Neutral
➜ SKIP
Daily Setup?
Pattern aligned with weekly bias?
➜ WAIT
Entry Trigger?
Momentum confirming in setup zone?
➜ WAIT
EXECUTE TRADE
All 3 layers aligned. Position sized. Risk defined.
When Timeframes Agree: The Power of Confluence
Confluence is the technical analysis equivalent of having the wind, the current, and the tide all pushing you in the same direction. When the weekly trend is bullish, the daily shows a clean pullback to support, and the 4H confirms a momentum reversal — that's a high-probability setup. Not because any single signal is guaranteed, but because multiple independent confirmation layers are agreeing simultaneously.
Here's what multi-timeframe confluence looks like in practice. Imagine you're analyzing AAPL:
Notice what happened there. The weekly gave you the direction (long only). The daily gave you the setup (pullback to moving average with healthy volume profile). The 4H gave you the trigger (bullish engulfing at the level). Each timeframe did one job. No overlap. No confusion. The entire analysis took about 30 seconds.
When you have multi-timeframe confluence, three things improve simultaneously:
Win Rate
Setups with 3-TF alignment have significantly higher follow-through than single-timeframe signals because you're trading with the structural trend, not against it.
R:R Ratio
Using a lower timeframe for entry means tighter stops. Tighter stops mean larger reward-to-risk ratios on the same target. A 2:1 daily trade becomes a 4:1 trade with a 4H entry.
Conviction
When three independent timeframes agree, you trade with confidence. You hold through normal pullbacks because you know the higher timeframe supports your thesis.
The key word above is independent. Each timeframe provides information the others don't. That's why multi-timeframe analysis works — it's not redundant confirmation (seeing the same signal three times). It's layered confirmation where each layer adds unique context. The weekly tells you things the daily can't. The daily tells you things the 4H can't. When they all point the same direction, you have a structural edge that no single timeframe can provide alone.
When Timeframes Conflict: How to Resolve the Contradiction
This is the hard part. When the weekly says one thing and the daily says another, what do you do? This is where most multi-timeframe tutorials fail you. They say "higher timeframe always wins" and leave it at that. That's 80% correct, but the 20% where it's wrong will cost you real money if you don't understand the exceptions.
Let's establish the default rule first, then cover the exceptions.
💡 DEFAULT RULE: HIGHER TIMEFRAME WINS
When timeframes conflict, defer to the higher timeframe. A daily buy signal inside a weekly downtrend should be treated as a countertrend rally until the weekly structure changes. A daily sell signal inside a weekly uptrend is likely a pullback, not a reversal. The higher timeframe represents more capital, more institutional participation, and more structural weight. It wins by default.
Now the exceptions. There are three scenarios where the daily timeframe can legitimately override the weekly bias:
Trend Transitions
Every weekly trend change starts on the daily chart first. By definition, the weekly can't reverse until enough daily candles have shifted the structure. So when you see the daily chart forming a clear base after a weekly downtrend — higher lows, volume expanding on up moves, moving averages flattening and starting to curl up — this is the daily chart leading a potential weekly trend change. The exception here is that you don't wait for the weekly to confirm the reversal (which could take weeks). Instead, you take the daily setup with a smaller position size and a tighter stop, acknowledging that you're anticipating a weekly shift, not trading a confirmed one.
Catalyst-Driven Divergences
Earnings surprises, FDA approvals, geopolitical events, and central bank decisions can create daily moves powerful enough to override weeks of weekly trend. When a stock gaps 15% on earnings and holds above a weekly resistance level on massive volume, the weekly chart hasn't caught up yet — it will print a single bullish candle on Friday. But the daily is already telling you the story. In catalyst scenarios, the daily can lead because the fundamental reality has shifted. The weekly chart is lagging, not leading. Size accordingly and use the daily structure for risk management.
Range-Bound Weekly + Trending Daily
When the weekly chart is range-bound (chopping between defined support and resistance), the daily chart's trend within that range becomes the dominant signal. A weekly range doesn't give you directional bias — it gives you boundaries. Within those boundaries, the daily chart's structure determines whether you trade long, short, or both. This isn't really an "exception" to the hierarchy — it's the hierarchy working correctly. The weekly is telling you "trade the range," and the daily is telling you which side of the range to play.
Save that matrix. Refer to it before every trade until it becomes automatic. It eliminates 90% of the uncertainty that makes multi-timeframe analysis feel contradictory. The remaining 10% is judgment — and the exceptions above cover that judgment systematically.
The Neural Engine Approach: Built-In Multi-Timeframe
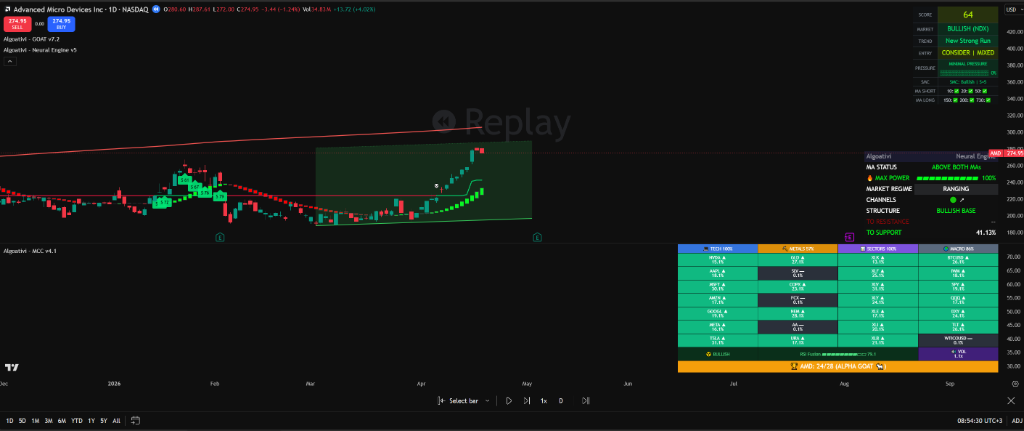
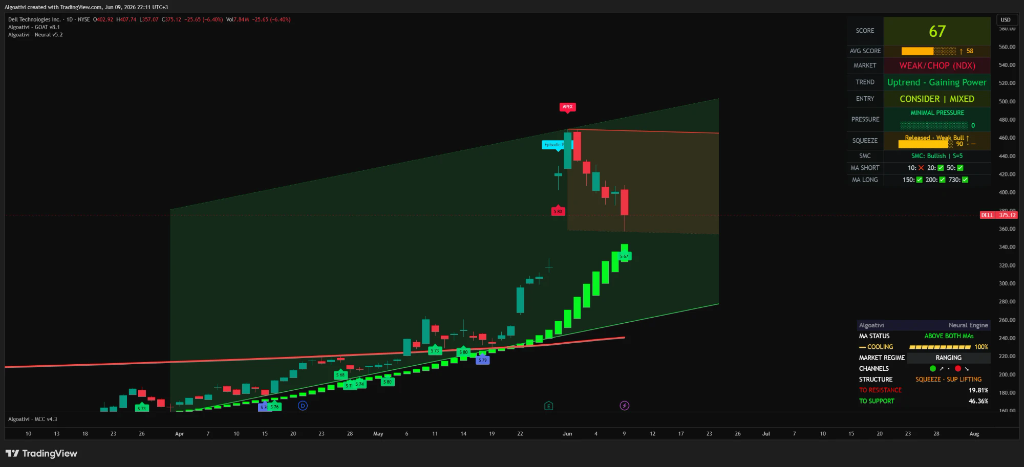
Here's where multi-timeframe analysis gets automated. The Neural Engine — one of AlgoatTV's core TradingView indicators — auto-draws trendlines across three distinct lookback ranges: Micro (50 bars), Mid (100 bars), and Macro (250 bars). Each range represents a different structural timeframe, but they all live on the same chart.
This is fundamentally different from manually switching between daily and weekly TradingView tabs. Instead of looking at two separate charts and trying to reconcile them in your head, the Neural Engine overlays all three structural layers on a single view. You see short-term, medium-term, and long-term trend structure simultaneously without flipping a single tab.
MICRO (50 BARS)
Short-Term Structure
Captures the immediate trend — the short-term momentum that drives entries and exits. On a daily chart, this covers roughly 2.5 months of price action. Equivalent to analyzing the 4H or daily chart separately. The trendlines drawn here show you the current swing structure.
MID (100 BARS)
Intermediate Trend
Captures the medium-term trend — the structural direction most swing trades align with. On a daily chart, this covers roughly 5 months. Equivalent to the daily-to-weekly transition zone. Trendlines here represent the "setup" timeframe.
MACRO (250 BARS)
Long-Term Direction
Captures the dominant trend — the structural bias that institutions are trading. On a daily chart, this covers roughly one year. Equivalent to the weekly chart's perspective. Trendlines here represent the "boss" in your hierarchy — the direction you should be trading.
When all three ranges draw trendlines in the same direction, you have the equivalent of weekly-daily-4H confluence — without ever switching tabs. The Macro says "bullish." The Mid says "still bullish." The Micro says "bullish and pulling back to the Macro trendline." That's your setup, identified in one glance on one chart.
When the ranges diverge, that's your conflict signal. If the Macro trendline is bullish but the Micro trendline has turned bearish, you're seeing the daily chart pulling back within the weekly trend — exactly the situation where you wait for realignment. If the Macro trendline breaks while the Micro is already bearish, the Mid will often be the last domino to fall, and you're watching a trend reversal unfold in real-time across all three structural layers.
WHY THIS MATTERS
Manual multi-timeframe analysis requires discipline. You have to remember to check the weekly before the daily. You have to resist the temptation to trade a daily signal that conflicts with the weekly. You have to do this consistently across dozens of tickers. The Neural Engine removes that discipline requirement by putting all three layers on the same screen. You can't not see the Macro trendline when you're looking at the Micro setup. The hierarchy enforces itself visually.
The practical advantage for TradingView users is significant. Instead of maintaining two or three chart layouts per ticker and mentally synthesizing the information, you load one chart with the Neural Engine and immediately see the relationship between short-term momentum, intermediate trend, and long-term direction. The trendlines do the multi-timeframe work for you. Your job shifts from "analyze three charts" to "read one chart's three layers" — which is faster, more consistent, and less prone to confirmation bias.
MULTI-TIMEFRAME ANALYSIS ON ONE CHART
Stop Flipping Between Tabs. Start Seeing All 3 Layers at Once.
The Neural Engine auto-draws trendlines across Micro (50), Mid (100), and Macro (250) bar ranges — giving you short-term, intermediate, and long-term structure on a single TradingView chart.
Try the Neural Engine Free for 7 Days →Full access to all indicators + AI Quant. Cancel anytime.
AI Quant Multi-TF Analysis
The Neural Engine gives you built-in multi-timeframe on a single chart. But what about comparing a daily chart to a weekly chart directly — side by side, with analysis that identifies agreement, conflict, and the key variable that matters most?
That's what AI Quant does. It's an AI-powered chart analysis tool built into AlgoatTV that accepts multiple TradingView screenshots simultaneously. You paste a daily chart and a weekly chart of the same ticker, and AI Quant cross-references them — identifying where the timeframes agree, where they conflict, and what the decisive variable is.
Here's the workflow and what it looks like in practice:
Capture Two Screenshots
Take a screenshot of the daily chart with your indicators loaded (GOAT Score, Neural Engine, or any setup you use). Then take a screenshot of the weekly chart for the same ticker. Make sure the Neural Engine trendlines are visible on both if possible. The AI reads the visual structure, so clear charts with visible indicators produce better analysis.
Paste Both Into AI Quant
Upload both screenshots in the same AI Quant session. Tell it you want a multi-timeframe analysis. The AI processes both images simultaneously and understands that they represent different views of the same asset. You can also include a 4H chart as a third image for full tri-layer analysis.
Get a Cross-Timeframe Verdict
AI Quant returns a structured analysis that includes: the trend direction on each timeframe, where the timeframes agree and disagree, the key level or variable that would resolve any conflict, and a synthesized recommendation. It doesn't just tell you what each chart shows — it tells you what the relationship between them means for your trade decision. That relationship is the entire point of multi-timeframe analysis, and it's the part most traders struggle with.
The value here is that AI Quant does the reconciliation step that most traders skip or do poorly. It's not enough to see the weekly and daily charts separately. The skill is in synthesizing them — determining what the relationship between them means, and whether that relationship supports a trade or argues against one. AI Quant does that synthesis in seconds, with the conflict resolution framework built in.
Common Multi-Timeframe Mistakes
Multi-timeframe analysis is straightforward in concept but easy to screw up in practice. Here are the most common mistakes and how to avoid them.
Analysis Paralysis (Too Many Timeframes)
Looking at seven timeframes doesn't make you more informed. It makes you more confused. The 5-minute, 15-minute, 1H, 4H, daily, weekly, and monthly charts will rarely all agree. If you require unanimous consensus across all seven, you'll never trade. Two to three timeframes is the sweet spot. Each one has a defined role. More than that introduces noise that masquerades as analysis. If you catch yourself saying "but the 15-minute shows..." while your weekly and daily are aligned, you've gone too far down the rabbit hole.
Letting the Lower Timeframe Override the Higher One
This is the most common and most expensive mistake. You check the weekly chart. It's clearly bearish. You check the daily. It's bouncing. "Maybe this is the bottom," you tell yourself. You go long. The daily bounce lasts two days, then the weekly trend resumes and you're stopped out. The daily chart cannot override a clear weekly trend. The only exception is a confirmed trend transition (see Section 5 above), and even then, you trade with reduced size. If you find yourself constantly rationalizing why the daily is "right" and the weekly is "wrong," you have a hierarchy discipline problem, not an analysis problem.
Skipping the Higher Timeframe Entirely
A surprising number of traders claim to use multi-timeframe analysis but only check the weekly chart when they want confirmation for a daily signal they've already decided to take. That's backwards. The weekly check should happen first, and it should determine whether you even look at the daily setup. If you're opening the weekly chart after you've already identified a daily buy signal, you're using multi-timeframe analysis as confirmation bias, not as a filter. Check the weekly before you ever open the daily. If the weekly says no, close the chart.
Using Timeframes That Are Too Far Apart
Comparing a 5-minute chart to a monthly chart is not multi-timeframe analysis. It's noise comparison. The signals on a monthly chart operate on a completely different timescale than a 5-minute chart, and the overlap between them is essentially zero. Stick to adjacent timeframes with a 3–5x multiplier: daily + weekly, 4H + daily, 1H + 4H. When the gap between your analysis timeframes exceeds 5x, the relationship breaks down. A monthly candle and a 5-minute candle are separated by a factor of roughly 2,000. There's no meaningful alignment to find.
Over-Fitting the Entry
Some traders get the hierarchy right but then ruin it by dropping to the 1-minute chart for their entry, trying to save an extra few cents on the fill. The entry timeframe still needs to be adjacent to the setup timeframe. If your setup is on the daily, a 4H entry is appropriate. A 1-minute entry is not — it will generate false signals at a rate that overwhelms any edge you got from the daily setup. You'll enter on a 1-minute "breakout" that reverses three minutes later. The entry precision should match the trade timeframe, not the shortest chart available.
Ignoring Timeframe-Specific Volume
Volume behaves differently on different timeframes. A high-volume daily candle might represent a single news event. A high-volume weekly candle represents sustained participation over five sessions. When you're doing multi-timeframe analysis, the volume on the higher timeframe matters more for trend confirmation. A daily breakout on heavy volume is encouraging. A weekly breakout on heavy volume is structural. If the weekly breakout happened on thin volume, the daily volume spike might be a one-day wonder, not the start of a sustained move. Always check volume in the context of the timeframe you're reading it on.
Frequently Asked Questions
What is multi-timeframe analysis in TradingView?
Multi-timeframe analysis in TradingView means examining the same asset on multiple chart timeframes — typically weekly and daily, or daily and 4-hour — to confirm trade setups before entering. TradingView makes this easy with its multi-layout feature (up to 8 charts simultaneously on paid plans) and the ability to draw objects that sync across timeframes. The goal is to use the higher timeframe for directional bias and the lower timeframe for precise entry timing, ensuring your trades align with the dominant trend rather than fighting it.
How many timeframes should I use?
Two to three timeframes is optimal. Two is sufficient for most swing traders (weekly for bias, daily for setup). Adding a third (4H for entry) can improve your risk-reward ratio but is optional. Going beyond three introduces analysis paralysis without meaningful improvement in accuracy. The marginal value of each additional timeframe decreases rapidly while the complexity of reconciling them increases exponentially. Keep it simple: one timeframe for direction, one for setup, and optionally one for trigger.
What's the best timeframe combination for swing trading?
For swing trading, the weekly + daily combination is the standard and most effective pairing. The weekly chart identifies the trend direction and major levels. The daily chart identifies entry setups (pullbacks, breakouts, reversal patterns) that align with the weekly bias. If you want to refine entries further, add the 4H chart as a third layer. For day trading, the equivalent pairing is daily + 1H or 4H + 15-minute. The principle is the same regardless of your trading style: one layer above your trading timeframe for bias, your trading timeframe for setups.
What do I do when the daily and weekly charts contradict each other?
The default rule is that the weekly (higher timeframe) wins. If the weekly is bullish and the daily is showing a bearish signal, that daily signal is most likely a pullback within the weekly uptrend, not a reversal. Wait for the daily to realign with the weekly bias before entering. The three exceptions are: trend transitions (daily leading a potential weekly reversal), catalyst-driven moves (earnings gaps that override weekly structure), and range-bound weekly charts (where the daily trend within the range becomes the dominant signal). In all exception cases, reduce position size.
Can multi-timeframe analysis work for crypto and forex?
Absolutely. The principles are asset-agnostic. Crypto markets are open 24/7, which makes the daily and weekly timeframes even more important as structural anchors because there's no natural "session" boundary. Forex traders commonly use the daily + 4H combination because currency pairs tend to trend strongly on the daily chart and offer clean intraday setups on the 4H. The only adjustment for crypto is that volatility is higher, so the same framework applies but your stop distances need to account for wider ranges. The hierarchy — higher timeframe sets the bias, lower timeframe finds the entry — works on any liquid market.
Does the Neural Engine replace traditional multi-timeframe analysis?
It complements it. The Neural Engine's three lookback ranges (Micro 50, Mid 100, Macro 250) provide a structural multi-timeframe view on a single chart, which eliminates the need to flip between tabs for trend alignment. But for full multi-timeframe analysis — especially when comparing a daily chart to a weekly chart with different indicator readings and structures — you may still want to pull up both timeframes, particularly for critical decision points. The Neural Engine handles the 80% of situations where you need quick multi-layer trend confirmation. For the 20% that require deep cross-timeframe analysis, AI Quant's multi-screenshot capability fills the gap by synthesizing both views into a single recommendation.
STOP CONTRADICTING YOURSELF ACROSS TIMEFRAMES
See Short-Term, Mid-Term, and Long-Term Structure — On One Chart
The Neural Engine auto-draws trendlines across 3 structural ranges. AI Quant analyzes multiple screenshots simultaneously. No more tab-flipping. No more conflicting signals.
Trade with every timeframe pointing the same direction. Not against yourself.
Start Your 7-Day Free Trial →Full access to Neural Engine, AI Quant, GOAT Score, and all indicators. Cancel anytime.
CONTINUE READING
How to Read Any Chart in 10 Seconds
The 5-question framework that turns analysis into a binary decision. Your chart reading foundation.
PILLAR GUIDESmart Money Concepts: The Complete Guide
Order blocks, FVGs, and institutional structure — the framework behind the levels that matter on every timeframe.
CLUSTER GUIDEHow to Read TradingView Indicators (Without Overthinking)
The framework for reading any indicator as confirmation, not a signal generator.
CLUSTER GUIDENo-Repaint Indicators: What They Are and Why They Matter
Why repainting indicators lie to you on backtests and how to verify signal integrity across timeframes.
This content is educational and does not constitute financial advice. Trading involves risk, and past performance does not guarantee future results. Always do your own research before making trading decisions.