Bollinger Keltner Squeeze Trading Guide | AlgoatTV
The chart goes quiet. Candles shrink. Volatility dies.
Most traders get bored and look away.
Smart traders lean in.
Because what comes next is usually explosive.
This is the squeeze. And it has a measurable signature.
A Bollinger Band squeeze occurs when Bollinger Bands contract and collapse inside the Keltner Channels. Both indicators measure volatility, but using different math — standard deviation vs. Average True Range. When the faster-reacting Bollinger Bands compress inside the slower Keltner Channels, it signals that volatility has reached an extreme low. Energy is coiling. Like a spring under compression, the release produces a powerful directional move. This guide explains the mechanics, the three phases of a squeeze, how to trade the release, and why squeezes on high relative strength assets produce the most explosive outcomes.
IN THIS GUIDE
What Are Bollinger Bands?
Bollinger Bands are a volatility envelope created by John Bollinger in the early 1980s. The concept is straightforward: plot a simple moving average (typically 20-period), then add and subtract a multiple of standard deviation from that average. The default setting uses 2 standard deviations, which statistically captures roughly 95% of price action within the bands.
The critical property of Bollinger Bands is that their width is entirely determined by standard deviation — a statistical measure of how much price disperses from the mean. When price action is volatile, standard deviation increases and the bands expand. When price action is quiet, standard deviation decreases and the bands contract. This expansion and contraction cycle is not random. It follows a measurable pattern: low volatility begets high volatility, and high volatility begets low volatility.
BOLLINGER BAND COMPONENTS
Most traders use Bollinger Bands as a mean-reversion tool: buy when price touches the lower band, sell when it touches the upper band. That's a valid use case in ranging markets. But the real power of Bollinger Bands — the feature that makes them essential for squeeze detection — isn't about price touching the bands. It's about the distance between the bands themselves. When that distance reaches an extreme low, something significant is about to happen.
The key insight: Bollinger Bands react quickly to volatility changes because standard deviation is sensitive to outlier moves. One or two large candles can expand the bands rapidly. Conversely, a string of small-bodied candles will collapse the bands just as fast. This sensitivity is exactly what makes Bollinger Bands one half of the squeeze equation.
What Are Keltner Channels?
Keltner Channels, named after Chester Keltner and later refined by Linda Raschke, are another volatility envelope — but they use a fundamentally different volatility measure than Bollinger Bands. Instead of standard deviation, Keltner Channels use Average True Range (ATR) to set their width. This single difference is what makes the squeeze detection possible.
ATR measures the average range of price bars over a lookback period, accounting for gaps between sessions. It's a smoother, more stable volatility measure than standard deviation. Where standard deviation can spike or collapse on a single candle, ATR changes gradually because it averages across multiple bars. The typical Keltner Channel uses a 20-period EMA as the center line and 1.5 × ATR for the channel width.
This difference in responsiveness is the entire foundation of squeeze detection. Under normal market conditions, Bollinger Bands are wider than Keltner Channels because standard deviation captures more of the price distribution. But during periods of extreme low volatility, standard deviation drops faster than ATR — causing the Bollinger Bands to contract inside the Keltner Channels. That crossover event is the squeeze.
Think of it this way: Keltner Channels represent the "normal" volatility baseline. When Bollinger Bands collapse inside that baseline, volatility has dropped below normal. The market is coiling. And coiled markets release.
The Squeeze: When Bollinger Bands Collapse Inside Keltner Channels
The squeeze is not a subjective pattern you interpret visually. It's a binary, measurable condition: either the Bollinger Bands are inside the Keltner Channels, or they're not. Specifically, a squeeze is active when the upper Bollinger Band is below the upper Keltner Channel AND the lower Bollinger Band is above the lower Keltner Channel. Both conditions must be true simultaneously. When they are, volatility measured by standard deviation has fallen below the volatility measured by ATR. The market is compressed.
Why does this matter? Because volatility is mean-reverting. It doesn't stay low forever. Extended periods of compression are invariably followed by expansion — and that expansion produces directional moves. The tighter the compression, the more violent the release. This isn't mysticism. It's a statistical property of price distributions: variance clusters, and periods of low variance are followed by periods of high variance.
💡 THE COILED SPRING
Imagine a spring compressed inside a tube. As long as the tube holds it, nothing happens. The spring stores kinetic energy. The longer and tighter the compression, the more energy is stored. When the tube is removed, the spring doesn't slowly uncoil — it fires. The squeeze is the compression. The Keltner Channel is the tube. When the Bollinger Bands expand back outside the Keltner Channels, the tube is removed. That's the release. Your job isn't to predict when the spring fires. Your job is to identify that it's compressed and then position yourself for the release.
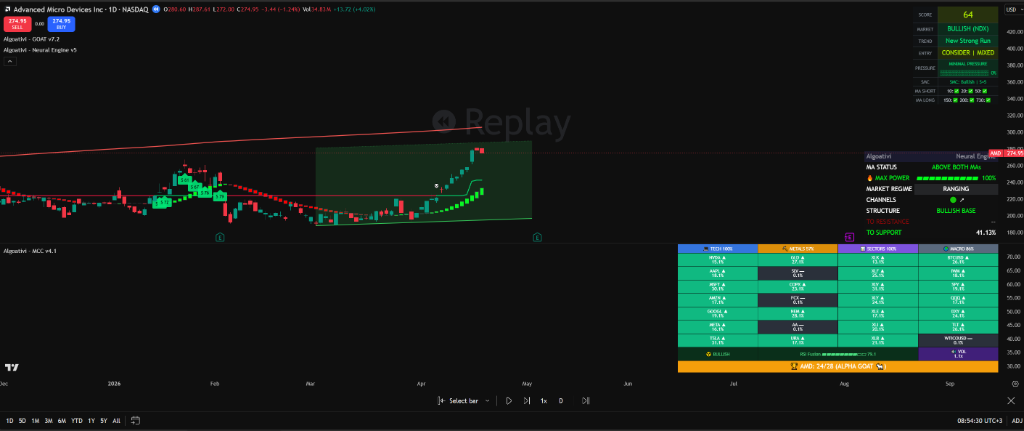
John Carter popularized this concept and called it the TTM Squeeze. The MCC Reactor's Squeeze Reactor uses the same underlying detection — identifying when Bollinger Bands are inside Keltner Channels — but goes further by firing directional arrows when the squeeze releases, giving you a clear signal of which way the energy is likely to flow. The GOAT Toolkit's composite scoring also incorporates BB+KC squeeze detection as one of its confluence inputs, weighting squeeze-release setups more heavily because they historically produce higher-probability directional moves.
What the Squeeze Does NOT Tell You
The squeeze tells you that a big move is coming. It does not tell you which direction. This is the single most important thing to understand. A squeeze is a volatility signal, not a directional signal. You need a separate tool to determine direction once the squeeze fires. This is why the Squeeze Reactor pairs the detection with momentum-based directional arrows, and why the GOAT Toolkit's composite score factors in trend structure and relative strength alongside the squeeze condition. The squeeze loads the gun. Momentum pulls the trigger.
The 3 Phases of a Squeeze
Every squeeze follows the same three-phase lifecycle. Understanding which phase you're in determines your action. Most traders lose money on squeezes because they act during the wrong phase — typically entering during compression instead of waiting for the release.
Compression
Squeeze is ON — BB inside KC
Bollinger Bands have contracted inside the Keltner Channels. Candles are small-bodied. Range is narrow. Volume often decreases. The market is in a holding pattern — accumulating energy but not yet showing direction. This is the preparation phase. You're watching, not trading.
Action: Mark the asset on your watchlist. Set alerts. Do not enter a position. The squeeze can last days, weeks, or even months. Trading during compression is a chop trap — price oscillates in a tiny range and stops get hunted in both directions.
Release
Squeeze fires — BB expand back outside KC
The Bollinger Bands expand and break back outside the Keltner Channels. A directional candle prints — larger body, increased volume, closing near its high (for bullish) or low (for bearish). This is the moment the spring fires. The Squeeze Reactor plots a directional arrow on this bar. Momentum has declared itself.
Action: Confirm direction using momentum (the Squeeze Reactor's directional arrow, MACD histogram direction, or linear regression slope). If momentum aligns with the release direction, this is your signal to prepare for entry. The optimal entry is not the release bar itself — it's the first pullback after the release, which confirms that buyers (or sellers) are defending the breakout level.
Follow-Through
Trend develops — ride the expansion
After the release, the Bollinger Bands expand as the new trend develops. Candles are larger-bodied, volume increases, and price moves away from the compression zone with momentum. This is where the squeeze pays off. The stored energy from weeks of compression translates into a trending move that can last significantly longer than most traders expect.
Action: Manage the trade. Use ATR trailing stops to stay in the trend as long as it persists. Do not set arbitrary profit targets that cut short a move that's been building for weeks. The follow-through phase is where you earn the reward for the patience you showed during compression.
🔎 PATTERN RECOGNITION
The longer the compression phase lasts, the more powerful the release tends to be. A squeeze that lasts 5 bars produces a smaller move than one that lasts 20 bars. Think of it as storing energy: more bars of compression = more energy stored = more explosive release. When you see a multi-week squeeze on a daily chart, pay attention. That setup doesn't appear often, and when it fires, the move is typically significant.
How to Trade the Squeeze
Knowing the mechanics is one thing. Executing the trade is another. Most traders who understand the squeeze concept still lose money on it because they violate one of three execution principles: they enter too early (during compression), they chase the release candle (FOMO entry at the worst price), or they fail to confirm direction (and get caught in a headfake).
Here's the systematic approach that removes emotion from the process.
SQUEEZE TRADE EXECUTION
Wait for the release, not the compression
The squeeze is your watchlist filter, not your entry signal. Add assets with active squeezes to your alert list. Set an alert for when Bollinger Bands expand back outside Keltner Channels — the release event. Do not trade inside the compression zone.
Confirm direction with momentum
When the release fires, check the Squeeze Reactor's directional arrow. Is it pointing up or down? Confirm with the momentum histogram: is the linear regression slope increasing (bullish) or decreasing (bearish)? If the release candle is ambiguous — small body, long wicks in both directions — stand aside. Wait for a clear directional bar.
Enter on the first pullback after release
The release candle is often extended — large body, high volume, far from the mean. Entering here gives you a poor risk/reward ratio because your stop would need to be wide. Instead, wait for the first pullback to a support zone: the 20-period moving average (the Bollinger Band midline), or the top of the compression range. This pullback confirms that buyers are defending the breakout and gives you a tighter stop.
Trail with ATR, let the trend work
Set an ATR trailing stop below your entry. As price extends in the follow-through phase, the trail moves with it, locking in gains while giving the trend room to breathe. Do not exit based on arbitrary targets. The whole point of the squeeze is that it signals a large move — don't cut it short with a 2:1 R:R target when the setup is built for 5:1 or more.
The Headfake Problem
Not every squeeze release leads to a sustained move. Sometimes the first directional bar reverses immediately — a headfake. The initial break goes one direction, traps traders, then reverses and runs the other way. Headfakes are more common when the squeeze fires without strong momentum confirmation, or when the release occurs on low volume.
The pullback entry method protects you from most headfakes. If the initial release reverses before pulling back to your entry zone, you never enter the trade. You avoid the trap because you refused to chase. Patience on the entry is the single best defense against headfakes.
The Squeeze Reactor helps here too: it doesn't just fire on the first bar outside the Keltner Channels. It evaluates the momentum direction at the point of release. If momentum is ambiguous, the signal quality is lower. When momentum is strong and aligned with the release direction, the signal quality is high. This is the difference between a raw squeeze detection and an intelligent squeeze system that filters for quality.
Squeeze + Relative Strength = Explosive Setups
Here's where the squeeze becomes more than just a volatility tool. When you overlay relative strength data onto squeeze detection, the quality of your setups improves dramatically. The logic is straightforward: a squeeze tells you a big move is coming, but it doesn't tell you which assets will produce the best moves. Relative strength does.
Consider two assets, both showing an active squeeze. Asset A has strong relative strength — it's been outperforming its peers even during the compression phase. Asset B has weak relative strength — it's been lagging the field. When both squeezes release, which one produces the bigger move? Consistently, the answer is Asset A. High relative strength during compression means institutional capital is already positioned in the asset. When volatility expands, that pre-positioned capital amplifies the move.
A weak-RS asset in a squeeze might release sideways or produce a short-lived pop that fails to follow through. A strong-RS asset in a squeeze is a loaded cannon with institutional backing. The squeeze is the trigger mechanism. Relative strength tells you how much gunpowder is behind it.
The GOAT Toolkit's composite scoring bakes this confluence directly into the signal. When the toolkit scores an asset, it evaluates the squeeze condition alongside relative strength tier, trend structure, and momentum alignment. An asset showing a squeeze release with strong relative strength receives a significantly higher composite score than one firing without RS support. You don't have to manually cross-reference two separate tools — the score does it for you.
This is why the squeeze concept supports the Relative Strength pillar. It's not a standalone strategy — it's a catalyst multiplier that makes your RS-based asset selection even more powerful. You identify the strongest assets via relative strength scanning. You wait for those assets to enter a squeeze. When the squeeze fires, you trade the release. The RS data gives you the direction bias. The squeeze gives you the timing.
Stop Scanning Manually
The Squeeze Reactor Detects Compression Automatically
The MCC Reactor's Squeeze Reactor monitors BB vs. KC compression in real time and fires directional arrows on the release. Combined with the GOAT Toolkit's relative strength scoring, you get squeeze signals that are pre-filtered for quality — not just any squeeze, but squeezes on the strongest assets in the field.
See the Squeeze Reactor in Action →Common Squeeze Mistakes
The squeeze is one of the most misused setups in technical analysis. The concept is simple, which makes traders overconfident in their execution. These are the mistakes that cost the most money.
Trading During Compression
The most common mistake by far. Traders see the squeeze forming, get excited, and enter before the release. The compression zone is a chop factory. Price oscillates in a tight range, hitting stops in both directions. Your entry fills, you get stopped out, and then the squeeze fires without you. The squeeze is a watchlist event, not an entry event. It tells you to get ready, not to act.
Ignoring Direction Confirmation
A squeeze release means volatility is expanding. It doesn't mean price is going up. Some traders assume squeezes are bullish. They're not. A squeeze release to the downside is just as valid and just as powerful. If you enter long on a squeeze without checking momentum direction, you have a 50/50 shot — and that's gambling, not trading. Always confirm direction with a momentum tool before entering.
Chasing the Release Candle
The release bar is often a wide-range candle. It looks powerful. It feels urgent. Entering at the close of that bar means your stop needs to be wide (below the compression zone), which destroys your risk/reward. Worse, the release bar sometimes gaps into the next session, making your actual entry even further from the stop level. Wait for the pullback. Let the urgency pass. The best entries come after the first retest of the breakout level.
Using Wrong BB/KC Settings
The squeeze detection depends on the relationship between BB width and KC width. If you use 1.5 standard deviations for BB (instead of the standard 2.0) or 2.0x ATR for KC (instead of 1.5x), you change the sensitivity of the detection. Tighter BB settings produce more frequent squeezes with lower reliability. Wider KC settings make squeezes rare but more powerful. Stick with the standard parameters: BB 20/2.0, KC 20/1.5. These are the settings the Squeeze Reactor uses.
Exiting Too Early After the Release
The squeeze stores energy over days or weeks of compression. When it releases, the resulting move often lasts much longer than traders expect. Taking a quick 2:1 profit on a setup that was designed for a trending move defeats the purpose. The squeeze is telling you that a regime change is happening: from low-volatility to high-volatility. Use a trailing stop and let the trend run. The move will tell you when it's done — don't impose your own timetable.
Trading Squeezes Without RS Context
A squeeze on a weak-RS asset is significantly less reliable than a squeeze on a strong-RS asset. Traders who scan for squeezes without filtering by relative strength end up trading every squeeze they find, including the low-quality ones on lagging assets. The result is a mediocre win rate that makes them abandon the strategy entirely. Filter squeezes by RS first. Only trade the ones on leaders.
Frequently Asked Questions
What settings should I use for Bollinger Bands and Keltner Channels?
The standard squeeze detection settings are Bollinger Bands with a 20-period SMA and 2.0 standard deviations, paired with Keltner Channels using a 20-period EMA and 1.5x ATR. These are the industry-standard parameters used by most squeeze implementations, including the MCC Reactor's Squeeze Reactor. Changing the BB multiplier to 1.5 or the KC multiplier to 2.0 will change the sensitivity and make the squeeze either too frequent (noisy) or too rare (missing setups). Unless you have a specific backtested reason to change them, stick with the defaults.
Does the squeeze work on all timeframes?
Yes. The BB/KC squeeze works on every timeframe from 5-minute intraday charts to monthly position charts. The math scales naturally — standard deviation and ATR both adjust to whatever timeframe you're analyzing. That said, higher timeframes produce more reliable squeezes because the compression represents more accumulated energy. A daily-chart squeeze that forms over 3 weeks is more meaningful than a 15-minute squeeze that forms over 3 hours. The MCC Reactor detects squeezes on whatever timeframe you have loaded, but the most tradeable signals come from the daily and weekly charts.
How do I know which direction the squeeze will release?
You don't know in advance — and anyone who claims they do is selling you something. The squeeze is a volatility signal, not a directional signal. Direction is determined at the point of release by momentum. The Squeeze Reactor uses momentum evaluation at the release bar to fire a directional arrow (bullish or bearish). Other methods include checking the MACD histogram direction, the slope of a linear regression line, or the trend structure leading into the squeeze. If the larger trend was bullish before the squeeze formed, the release tends to continue in that direction — but it's not guaranteed. Always wait for momentum confirmation.
What is the difference between the Squeeze Reactor and the TTM Squeeze?
The TTM Squeeze, created by John Carter, uses the same core detection: Bollinger Bands inside Keltner Channels. The MCC Reactor's Squeeze Reactor builds on this foundation with enhancements. It fires directional arrows at the point of release based on momentum evaluation, integrates with the broader MCC Reactor ecosystem (including trend and momentum analysis from the other reactor components), and its squeeze state feeds into the GOAT Toolkit's composite scoring. The underlying detection logic is conceptually identical, but the Squeeze Reactor adds signal quality filtering and multi-indicator integration that a standalone squeeze indicator doesn't provide.
Can I use the squeeze on crypto, forex, and commodities, or only stocks?
The squeeze works on any liquid asset that produces clean candlestick data. Stocks, ETFs, crypto, forex pairs, commodities, and indices all exhibit the volatility compression-expansion cycle. The mechanics are universal because they're driven by the statistical properties of price distributions, not by the specific market. Crypto tends to produce tighter, shorter-duration squeezes on daily charts because its baseline volatility is higher. Forex squeezes tend to last longer because currency pairs often trend slowly. The GOAT Toolkit's relative strength scanner covers tech stocks, metals, sectors, and macro assets — and the squeeze detection works across all of them.
Volatility Compression Is Opportunity
Squeeze Detection + Relative Strength Scoring. One Toolkit.
The MCC Reactor's Squeeze Reactor detects BB/KC compression and fires directional arrows on release. The GOAT Toolkit scores every signal with relative strength, trend structure, and momentum confluence. Together, they surface the highest-probability squeeze setups — on the strongest assets — automatically.
Get the GOAT Toolkit →Join traders who wait for the squeeze, then strike.
Further Reading
How Relative Strength Scanning Changes Everything
The parent guide for this article. Understand why trading the strongest assets in the field produces consistently better results than isolated chart analysis.
Sector Rotation: Follow the Money Before It Moves
How capital rotates between sectors during different market phases, and how relative strength scanning tracks these flows in real time.
How to Read Any Chart in 30 Seconds
The foundation: structure, trend, and momentum reading. Understand chart context before evaluating any squeeze setup.
This content is educational and does not constitute financial advice. Trading involves risk, and past performance does not guarantee future results. Always do your own research before making trading decisions.