Why You Hold Losers Too Long (And the Exit System That Fixes It)
You're down 8%. The thesis still makes sense. The chart looks... okay. Maybe it'll bounce.
You hold. It drops to −15%. Now you can't sell because you've already lost too much.
You hold. −22%. You finally sell at the worst possible moment — the exact bottom. Three days later, it rallies 12%.
This isn't bad luck. This is a pattern.
And you'll repeat it until you install a system that doesn't care about your feelings.
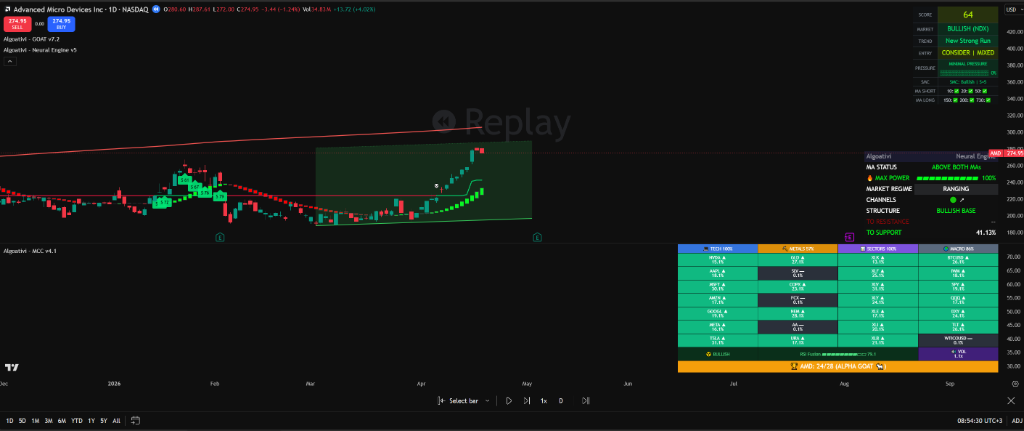
Most traders exit based on emotion — fear, hope, denial — not data. Exit pressure systems measure selling intensity independently of your entry thesis, giving you an objective gauge that says "the trade is dying" before your ego admits it. Combined with ATR-based trailing stops that adapt to volatility, you get a complete exit framework: the pressure tells you when to act, and the trailing stop tells you where. This guide builds that system from scratch.
IN THIS GUIDE
The Psychology of Bag-Holding
Before we fix the problem, we need to understand why it happens. And the uncomfortable truth is: your brain is wired to hold losers. This isn't a character flaw. It's neuroscience. The same cognitive machinery that kept your ancestors alive on the savanna is now draining your trading account.
Loss Aversion: The $100 You Lost Hurts More Than the $100 You Made
Daniel Kahneman's research on prospect theory demonstrated something every trader already feels: losses are psychologically weighted roughly 2x heavier than equivalent gains. A $500 loss on a trade doesn't just feel bad — it feels twice as bad as a $500 gain feels good. This asymmetry creates a predictable behavior pattern: you'll endure enormous unrealized pain rather than convert it into a realized loss.
Here's why this is devastating for traders: an unrealized loss feels like a maybe, but a realized loss feels like a fact. As long as the position is open, your brain categorizes it as "temporarily down." The moment you sell, it becomes a permanent entry in your trading record. Your brain will do almost anything to avoid that permanence — including holding a deteriorating position for weeks while the damage compounds.
The Sunk Cost Trap
You bought at $50. It's now $42. You've already "invested" the mental energy of researching the trade, the emotional energy of entering it, and the financial commitment. Selling at $42 means all of that was wasted. So you hold — not because the trade still makes sense, but because you can't accept that your prior investment of time, energy, and money was for nothing.
The rational response is obvious to everyone except the person in the trade: the money you already lost is gone regardless of what you do next. The only question is whether the remaining capital is better deployed here or somewhere else. But sunk cost reasoning doesn't operate on logic. It operates on ego.
Confirmation Bias: The Echo Chamber of a Losing Trade
The moment a trade goes against you, your research habits change. You stop looking for reasons the trade might fail and start looking for reasons it might recover. You read only the bullish posts. You filter out the bearish analysis. You find one analyst with a price target above your entry and anchor to it. Meanwhile, the chart is printing lower highs, volume is drying up, and institutional holders are quietly reducing positions. But you don't see any of that because you've built a confirmation bubble around a dying thesis.
Notice the pattern: the decision to sell is never made from analysis. It's made from exhaustion. The trader doesn't exit because the data says to — they exit because the emotional pain crosses a personal threshold. And that threshold has nothing to do with where the chart actually reverses.
💡 THE CORE INSIGHT
You cannot out-discipline these biases. Loss aversion, sunk costs, and confirmation bias aren't bad habits you can willpower your way through — they're hardwired into your neural circuitry. The only solution is to outsource the exit decision to a system that doesn't have a nervous system. You need a gauge that monitors selling pressure independently of your feelings, your thesis, and your entry price. That's what exit pressure does.
Why Stop-Losses Alone Don't Work
The standard advice is simple: set a stop-loss. And it's not wrong — a stop-loss is infinitely better than no stop-loss. But most traders implement stops so poorly that they end up creating a different kind of damage.
The problem isn't the concept of stops. The problem is that stops are mechanical, but markets are dynamic. A static rule applied to a dynamic environment will misfire constantly. Let's break down the three most common stop-loss methods and why each one fails in its own way.
Fixed-Percentage Stops: One Size Fits Nothing
"I always set a 5% stop-loss." Sounds disciplined. But a 5% stop on a stock that routinely swings 4% in a single day is going to get triggered by normal volatility. You're not managing risk — you're getting stopped out of positions that were behaving perfectly normally for that asset's personality. Meanwhile, a 5% stop on a low-volatility utility stock might be far too wide, allowing significant damage before it triggers.
Fixed-percentage stops ignore the one variable that should determine stop distance: the asset's actual volatility. Bitcoin's normal daily range is not the same as Johnson & Johnson's normal daily range. Treating them identically is setting yourself up for premature exits on volatile assets and late exits on stable ones.
Stop Hunting: The Market Sees Your Stop
When thousands of retail traders place stops at the same round number or obvious support level, those stops become liquidity targets. Price dips below support, triggers a cascade of sell orders, market makers fill their longs at discount prices, and the stock reverses immediately. You were right about the direction. You were right about the asset. But your stop was at the same level as every other retail trader, and the market harvested your position before continuing the move without you.
Trailing Stops Without Context: Locking In Gains at the Wrong Time
Simple trailing stops — "move my stop up $1 for every $1 of gain" — sound logical but lack market context. In a strong trend, a tight trailing stop will get triggered by a normal pullback, taking you out of a move that continues for weeks. In a weakening trend, a loose trailing stop will let profits evaporate as the trend gradually deteriorates. The trailing stop has no idea whether the pullback is temporary or the start of a reversal. It just follows a formula.
Fixed % Stops
Ignore volatility. Too tight on BTC, too wide on bonds. Constant whipsaws on volatile assets.
Obvious Level Stops
Everyone sees the same support. Stops cluster. Smart money hunts them. You exit, it reverses.
Simple Trailing Stops
No awareness of trend health. Lock gains too early in strong moves, too late in weak ones.
WHAT'S ACTUALLY MISSING
Stop-losses address where to exit but not when conditions have actually changed. What you need is a companion gauge that reads the health of the trade in real-time — one that can tell you the difference between a normal pullback in a healthy trend and a structural deterioration that's about to accelerate. That gauge exists. It's called exit pressure.
What Is Exit Pressure?
Exit pressure is an independent gauge that measures selling intensity in real-time, completely separate from the entry score. Think of it as a second opinion that doesn't care about your thesis, your conviction, or your average cost.
Most indicators give you one signal: bullish or bearish, buy or sell. The GOAT Toolkit separates these into two distinct engines. The GOAT Score (0–100) tells you how favorable the current setup is — trend, momentum, volume alignment. The Exit Pressure Engine (0–100%) independently monitors how much selling intensity is building beneath the surface.
Why does the separation matter? Because selling pressure builds before the headline score drops. The score is a composite of multiple factors, and it moves gradually. Exit pressure detects the early fractures — the moments when distribution is increasing, momentum is decaying, and smart money is quietly reducing exposure — before those fractures are large enough to drag down the overall score.
This creates a critical early warning scenario: you can have a GOAT Score of 70 (bullish territory) and an exit pressure of 80% (extreme selling intensity) at the same time. That divergence IS the warning. The score still looks fine because not all components have deteriorated yet. But the pressure engine is screaming that the underlying structure is breaking down. The score will catch up. It always does. The question is whether you'll still be in the trade when it does.
Think of it like a car's dashboard. Your speedometer might read 60 mph, but if your temperature gauge is redlining and your oil pressure is dropping, the speed number is irrelevant — the engine is about to seize. Exit pressure is the temperature gauge of your trade. The score is the speedometer. Both matter. But when they diverge, the pressure gauge wins.
How Exit Pressure Works
Exit pressure isn't a single calculation. It's a composite engine that monitors three distinct categories of deterioration, each of which tends to appear at different stages of a trade's decline. Understanding what each category measures helps you interpret the pressure reading with more nuance.
1. Volume Distribution Patterns
Healthy trends have a specific volume fingerprint: volume expands on moves in the trend direction and contracts on pullbacks. When this relationship inverts — volume surges on down moves and fades on rallies — it signals that the balance of power is shifting from buyers to sellers. The exit pressure engine tracks this distribution ratio continuously, flagging when the volume character changes even if the price hasn't broken any obvious levels yet.
This is often the first warning sign. Institutional sellers can distribute positions gradually over days or weeks, suppressing the appearance of heavy selling on the price chart. But the volume distribution pattern shifts measurably — if you know what to look for. The exit pressure engine automates this detection.
2. Momentum Decay
Momentum decay is what happens when price is still moving in the right direction, but the rate of that movement is slowing. Think of a ball thrown into the air: it's still going up, but it's decelerating. The peak is approaching even though the direction hasn't changed yet.
The exit pressure engine monitors multiple momentum timeframes simultaneously, detecting when shorter-term momentum starts diverging from longer-term momentum. When the 5-period momentum is fading while the 20-period momentum still looks healthy, that's the early stage of momentum decay. When both are fading, the deterioration is advanced. This multi-timeframe momentum monitoring catches the deceleration phase that most single-indicator approaches miss entirely.
3. Structural Deterioration
Structure refers to the pattern of higher highs and higher lows (in an uptrend) or lower highs and lower lows (in a downtrend). Structural deterioration occurs when these patterns break — a higher high that fails to materialize, a pullback that cuts deeper than the previous one, a support level that holds once but cracks on the second test. These structural failures are the most definitive signal that a trend is changing character, and the exit pressure engine weighs them accordingly.
The trader who monitors exit pressure exits at step 2, with the score still above 60, taking a small loss or a reduced gain. The trader who ignores it — or doesn't have it — holds through step 3 and sells at step 4, converting a manageable pullback into a portfolio-damaging drawdown.
That gap between step 2 and step 4 is the entire value proposition of exit pressure. It's the distance between a disciplined adjustment and an emotional capitulation.
The Exit Pressure States
Exit pressure reads on a scale from 0% to 100%. Each range corresponds to a distinct market condition and a specific action. Memorize this table — it should become the operational framework you reference every time you check an open position.
⚠ THE RULE THAT SAVES YOUR ACCOUNT
When exit pressure hits 80%+, you exit. Period. It doesn't matter if the GOAT Score is still 65. It doesn't matter if your favorite analyst just posted a bullish target. It doesn't matter if the thesis "still makes sense." Extreme exit pressure means the selling intensity has reached a level where further downside is the highest-probability outcome. The traders who survive long enough to compound wealth are the ones who follow this rule without exception.
Exit Pressure Is Built Into the GOAT Toolkit
See real-time selling intensity on your chart. The 0–100% gauge, the pressure states, the divergence warnings — all running live on any TradingView asset.
Start Your Free 7-Day Trial →No credit card required. Full access to all three indicators.
ATR-Based Trailing Stops
If exit pressure tells you when conditions are changing, your trailing stop defines where to actually place the exit. And the most reliable way to set a stop that adapts to the market — rather than fighting it — is the Average True Range (ATR).
What ATR Measures
ATR calculates the average range of price movement over a specified period, factoring in gaps between sessions. It doesn't tell you direction — it tells you how much an asset normally moves. A stock with an ATR of $3 routinely swings $3 in a single session. Placing a stop $2 away on that stock means you'll get stopped out by normal noise. Placing it $4–$5 away gives the trade room to breathe while still protecting against a genuine breakdown.
Why ATR Trailing Beats Fixed-Percentage Trailing
A fixed-percentage trailing stop treats every asset identically. A 3% trail on a volatile growth stock will get clipped daily. The same 3% trail on a stable dividend stock will let the position bleed for weeks before triggering. ATR solves this by calibrating the stop distance to each asset's actual behavior.
Fixed 5% Trailing Stop
• BTC (ATR ~4%): Gets stopped on normal daily swings
• AAPL (ATR ~2%): Stop sits too far away, allows excessive drawdown
• Same rule, different outcomes, no adaptation
• Constant whipsaws or excessive losses depending on the asset
2x ATR Trailing Stop
• BTC (ATR ~4%): Stop sits ~8% away — survives normal noise
• AAPL (ATR ~2%): Stop sits ~4% away — tight enough to protect
• Same multiplier, different distances, asset-appropriate
• Adapts automatically as volatility expands or contracts
How the GOAT Toolkit's ATR Trailing Stop Works
The GOAT Toolkit includes a built-in ATR trailing stop with a feature that standard ATR stops lack: auto-invalidation. Here's what that means.
A standard ATR trailing stop follows price upward and stays put when price drops. It trails from the highest point, always using the same ATR multiplier. The GOAT Toolkit's version does the same, but it also integrates with the exit pressure reading. When exit pressure rises above 40%, the effective ATR multiplier tightens automatically — the stop moves closer to current price because the system recognizes that conditions have deteriorated and the trade needs a shorter leash.
And when exit pressure hits 80%+, the auto-invalidation triggers: the system flags the trade as structurally compromised regardless of where the ATR stop sits. This prevents the scenario where a wide ATR stop on a volatile asset allows a slow bleed to continue long after the trade's thesis has collapsed.
ATR + EXIT PRESSURE = ADAPTIVE EXITS
Neither ATR stops nor exit pressure are sufficient alone. ATR stops define where to exit but don't know why the trade is failing. Exit pressure knows why conditions are deteriorating but doesn't define a price level. Combined, you get a system that tightens stops when selling pressure builds and triggers a hard exit when pressure reaches extreme levels — the first truly adaptive exit system that responds to market conditions in real-time.
Building Your Complete Exit System
Theory is useless without a framework you can execute. Here's the complete exit system, step by step. Five rules. No ambiguity. No room for your feelings to override the process. Print this out, tape it to your monitor, and follow it without exception.
Set Initial Stop at ATR-Based Level
At entry, place your stop at 2x ATR below your entry price (for longs) or above (for shorts). This gives the trade room to breathe within normal volatility while defining a clear invalidation level. If the asset moves beyond 2x its normal range against you, the thesis is likely broken. This is your "worst case" line in the sand. Non-negotiable.
Monitor Exit Pressure Daily
Check exit pressure on every open position at least once per session. Under 20%? You're fine — let the trade work. Between 20–40%? Acknowledge it, review your thesis, and prepare your exit plan. This is the monitoring phase. Most of the time, pressure will fluctuate between 0–30% and no action is needed. The system is designed so that doing nothing is the correct response most of the time.
Tighten Stop When Pressure Rises Above 40%
When exit pressure crosses 40%, reduce your ATR multiplier from 2x to 1.5x or tighter. The trade is no longer in "healthy pullback" territory — conditions are deteriorating and you need a shorter leash. If you're in profit, this is also the time to consider taking partial profits (25–50% of the position). Lock in some gains while giving the remaining position a chance to recover.
Exit When Pressure Hits 80%+ Regardless of Score
This is the rule. No exceptions. When exit pressure reaches 80% or higher, close the position. It doesn't matter if the GOAT Score is still showing 60. It doesn't matter if price is only down 3% from your entry. It doesn't matter if the earnings report is tomorrow and "might save it." Extreme selling pressure at this level precedes the worst drawdowns. Remove yourself from the trade. You can always re-enter when conditions stabilize.
Never Override the System With Feelings
This is the hardest step and the most important one. Your brain will generate a dozen reasons to stay in the trade: "but the fundamentals are strong," "but it's oversold now," "but I'll lose too much if I sell here." These are the same rationalizations that produce bag-holders. The system exists specifically because your judgment is compromised when you're in a losing position. Trust the pressure reading. Trust the stop level. Execute the plan.
✅ THE 5-STEP CHECKLIST (BOOKMARK THIS)
Entry: Place stop at 2x ATR below entry.
Daily: Check exit pressure. Under 20% = hold. 20–40% = watch.
Alert: Pressure above 40% = tighten stop to 1.5x ATR. Consider partial exit.
Critical: Pressure above 80% = exit. No exceptions.
Always: Follow the system. Override = bag-hold.
The Cost of NOT Having an Exit System
Let's make this tangible. Exit system conversations tend to stay abstract — "manage your risk," "cut losers quickly," "protect your capital." But the math tells a much more concrete story. And the math is uncomfortable.
The Bag-Hold Math
A typical bag-held trade — one where you entered with a thesis, ignored deteriorating conditions, and eventually sold at an emotional breaking point — costs between $500 and $5,000 depending on your position size. That's the difference between where the exit system would have gotten you out (exit pressure at 40–60%, taking a 3–8% hit) and where you actually sold (emotional capitulation at the bottom, taking a 20–35% hit).
Conservative traders might bag-hold one position every two months. Active traders might do it once a month or more. Let's run the numbers on even the most conservative scenario.
The Compounding Cost You Don't See
The direct dollar loss is only part of the damage. Every dollar trapped in a bag-held position is a dollar that can't be deployed to a winning trade. The opportunity cost of holding a loser for three months while better setups pass by is often larger than the loss itself.
And there's a psychological cost that compounds over time. Every bag-held trade erodes your confidence in your own decision-making. After three or four of them, you start hesitating on good entries because you're afraid of getting trapped again. You become timid precisely when you should be decisive. The emotional scar tissue from holding losers makes you a worse trader on every subsequent trade — even the winners.
An exit system doesn't just save you money on losers. It protects the quality of your decision-making on everything else. That's the real return on investment — and it compounds forever.
Frequently Asked Questions
Stop Holding Losers. Start Using Exit Pressure.
Real-time selling intensity. ATR trailing stops. Auto-invalidation. One system.
The GOAT Toolkit's Exit Pressure Engine monitors every open position for you — detecting distribution, momentum decay, and structural breakdown before they become catastrophic losses. 7-day free trial. No credit card.
Start Your Free Trial →No credit card. Full access. All three indicators. Cancel anytime.
CLUSTER GUIDE
ATR Trailing Stops on TradingView: Complete Setup Guide →
CLUSTER GUIDE
The Psychology of Bag-Holding: Why Smart Traders Still Hold Losers →
PILLAR GUIDE
How to Read Any Chart in 30 Seconds →
⚠ NFA — Not financial advice. Algoat.TV provides educational and analytical tools only. All trading decisions are yours. Trading involves risk of loss. Past performance does not guarantee future results.