ATR Trailing Stops Explained
You set a stop 5% below your entry. You've done this a hundred times. The market dips 5.2%, hunts your stop, and reverses immediately. You watch the exact trade you planned — without you in it — rally 30% over the next three weeks. This wasn't bad luck. Your stop was predictable. And the market ate it for breakfast.
Fixed-percentage stops are the training wheels of risk management. They feel logical. They're easy to calculate. And they ignore the single most important variable in determining where your stop should sit: how much the asset actually moves.
A 5% stop on a low-volatility utility stock might be generous. That same 5% stop on a small-cap biotech that routinely swings 8% intraday is a guaranteed stop-hunt. You're not managing risk — you're donating liquidity to market makers who see your stop sitting exactly where everyone else's sits.
This guide explains how ATR trailing stops solve this problem by calibrating your exit distance to the asset's actual volatility, why the GOAT Toolkit builds auto-invalidation on top of ATR, and exactly how to configure multiplier settings for your trading style. If you've ever been stopped out of a winning trade by normal market noise, this is the fix.
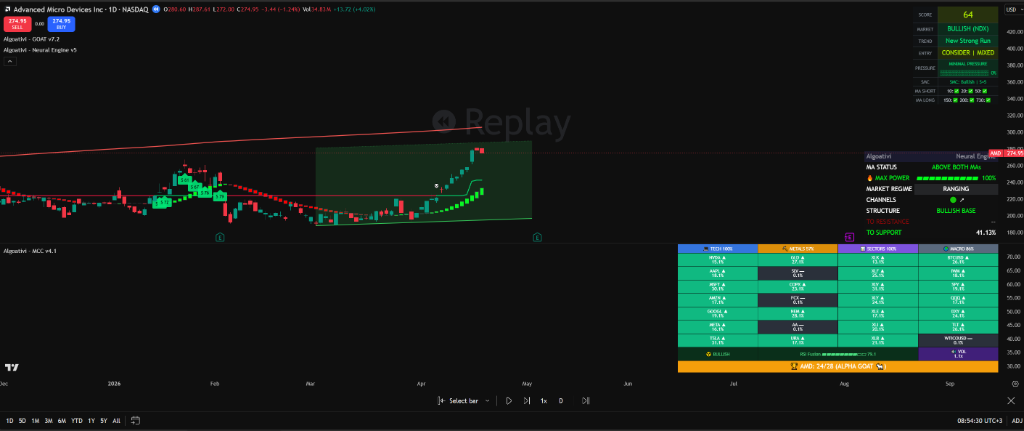
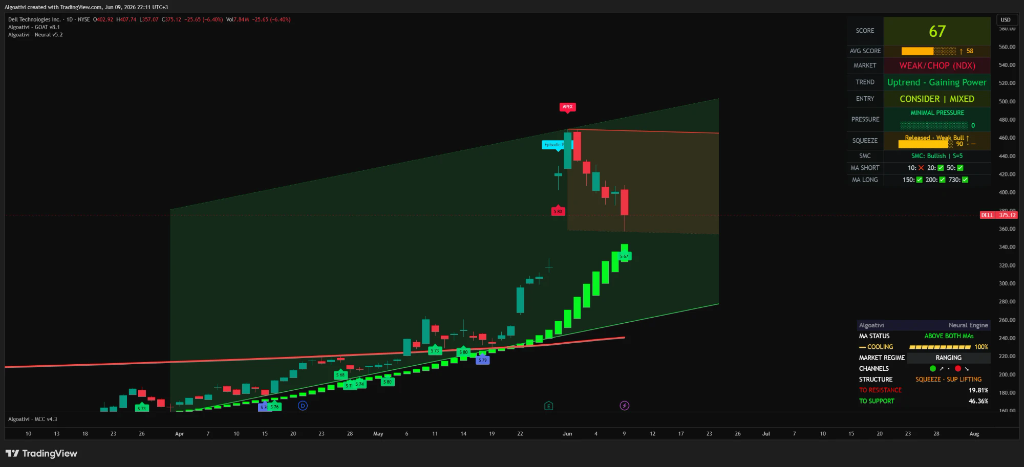
An ATR trailing stop uses Average True Range — a measure of real-time volatility — to set your stop distance. Instead of a fixed percentage, the stop sits a multiple of ATR below the highest price since entry. Low-volatility environments get tighter stops. High-volatility environments get wider stops. The GOAT Toolkit adds auto-invalidation: if price closes below the ATR trailing level, the trade is automatically marked as invalidated — no emotion, no second-guessing, no hoping for a bounce.
Table of Contents
What Is ATR (Average True Range)?
Average True Range is a volatility indicator developed by J. Welles Wilder in 1978. It doesn't tell you direction. It doesn't tell you whether to buy or sell. It tells you one thing: how much an asset typically moves in a given period. That single measurement is the foundation of intelligent stop placement.
ATR calculates the "true range" for each bar by taking the greatest of three values:
True Range = Maximum of:
ATR then averages these true range values over a lookback period (typically 14 bars). The result is a single number that represents the asset's average movement per bar, accounting for gaps.
Why does this matter for stops? Because ATR gives you a volatility-calibrated ruler. If a stock's 14-period ATR on the daily chart is $2.50, that tells you the stock moves roughly $2.50 per day under normal conditions. A stop placed $1.00 below your entry is sitting well inside the noise zone — it's almost guaranteed to get hit by routine price action. A stop placed $5.00 below entry gives the trade room to breathe through normal fluctuations.
The key insight: ATR is dynamic. When volatility expands (earnings, news events, market stress), ATR increases and your stop automatically widens. When volatility contracts (consolidation, low-volume periods), ATR decreases and your stop tightens. You're not guessing. The market is telling you exactly how much room the trade needs, and you're listening.
Why Fixed Stops Fail
Fixed-percentage stops treat every asset and every market condition identically. A 5% stop on Tesla gets the same treatment as a 5% stop on Procter & Gamble. A 5% stop during a VIX-at-12 grind gets the same distance as a 5% stop during a VIX-at-35 selloff. This is not risk management. This is a one-size-fits-all policy applied to a market that never wears the same size twice.
Here's the structural problem: fixed stops are visible and predictable. Round numbers (5%, 10%, 15%) cluster stops at obvious levels. Market makers, algorithms, and institutional desks know exactly where retail stops sit because they're all parked at the same percentage offsets. The result is stop hunts — short-term price moves engineered to trigger a cluster of stops, generate liquidity, and then reverse. You're not managing risk. You're painting a target.
| Dimension | Fixed % Stop | ATR Trailing Stop |
|---|---|---|
| Adapts to volatility | No — same % regardless of conditions | Yes — widens in high vol, tightens in low vol |
| Stop-hunt resistance | Low — clusters at round numbers | High — unique to each asset's behavior |
| Cross-asset consistency | Inconsistent risk across different tickers | Normalized risk — each stop fits the asset |
| Profit protection | Static — never trails with momentum | Dynamic — ratchets up as price advances |
| Regime awareness | Blind — same in trending and choppy markets | Adaptive — reflects current market regime |
| Position sizing integration | Arbitrary — % chosen by feel | Precise — ATR distance drives size calculation |
| Emotional interference | High — tempting to widen when scared | Low — mathematically derived, less ambiguity |
Consider a practical example. You buy NVDA at $120 and set a 5% stop at $114. NVDA's 14-day ATR is $6.80 — meaning it routinely moves nearly $7 in a single day. Your $6 stop is sitting inside one day's normal range. The odds of getting stopped out by noise are enormous, even if your trade thesis is perfectly correct.
Now compare: you buy PG at $165 with the same 5% stop at $156.75. PG's 14-day ATR is $2.10. Your $8.25 stop sits nearly 4x ATR away. You've given a low-volatility consumer staple almost four days of movement to prove itself, while giving a high-volatility tech stock less than one day. The risk you're taking isn't equal at all — it just looks equal because the percentage is the same.
How ATR Trailing Stops Work
An ATR trailing stop combines two mechanics: volatility-calibrated distance and one-directional ratcheting. The stop is placed a specific multiple of ATR below the highest close (for longs) or above the lowest close (for shorts) since entry. As the trade moves in your favor, the stop only moves in one direction — it never moves backward. This creates a floor that rises with momentum and locks in profit as the trend extends.
ATR Trailing Stop — Step-by-Step Mechanics
Calculate ATR
Measure the 14-period Average True Range on your chart timeframe. This gives you the asset's current volatility in price units. For example, ATR(14) = $3.20 on the daily chart means the asset averages $3.20 of movement per day.
Apply the Multiplier
Multiply ATR by your chosen factor (e.g., 2x). With ATR = $3.20 and a 2x multiplier, your stop distance is $6.40. This is the "breathing room" you're giving the trade. The multiplier controls how loose or tight the stop sits relative to normal volatility.
Set Initial Stop Level
Subtract the ATR distance from the highest close since entry. If you entered at $100 and the highest close is still $100, your initial stop sits at $100 − $6.40 = $93.60. For short trades, the stop is placed above the lowest close.
Trail — Only Forward
Each new bar, recalculate: Highest Close − (ATR × Multiplier). If the new level is higher than the current stop, the stop moves up. If it's lower, the stop stays where it is. The stop never moves down. Price at $108 with ATR still at $3.20? New stop = $108 − $6.40 = $101.60. You've locked in profit.
Exit on Close Below Stop
When price closes below the trailing stop level, the trade is invalidated. Not on an intrabar wick — on a confirmed close. This prevents false triggers from intraday spikes. The close-based trigger is critical: it filters noise while still respecting the volatility boundary you've defined.
Here's why this is fundamentally different from a fixed stop. As the trade progresses, the ATR trailing stop responds to two things simultaneously: price advancement and volatility changes. If volatility compresses mid-trend (a common behavior in strong momentum moves), ATR decreases and your trailing stop tightens — locking in more profit. If volatility expands (maybe earnings are approaching), ATR increases and your stop gives the trade more room. You don't have to manually adjust anything. The math does it for you.
The trailing mechanic also solves the single biggest problem in trade management: letting winners run. Without a trailing stop, you're constantly tempted to take profit too early. With an ATR trail, you have a clear, objective rule: the trade stays open until the trailing level is violated. If the stock runs from $100 to $180, your stop ratchets up the entire way. You capture the majority of the trend without making a single discretionary decision about when to sell.
ATR Multiplier Settings
The multiplier is the single most important parameter in your ATR trailing stop. It controls the tradeoff between stop-hunt protection and profit capture speed. A higher multiplier gives the trade more room but returns more profit to the market before exiting. A lower multiplier protects profit more aggressively but increases the risk of getting stopped out by normal volatility.
There is no universally "correct" multiplier. The right setting depends on your timeframe, the asset you're trading, and your strategy's holding period. Here's how the three most common settings behave in practice:
| Multiplier | Profile | Best For | Trade-off | Stop Distance Example (ATR = $3.00) |
|---|---|---|---|---|
| 1.5x | Conservative | Swing trades, mean-reversion strategies, high win-rate systems | Tighter protection, more frequent exits. Higher chance of re-entry needed. | $4.50 below high |
| 2.0x | Balanced | Most traders, trend-following, daily charts, general-purpose risk management | Balanced noise filtering with profit capture. The sweet spot for most strategies. | $6.00 below high |
| 3.0x | Aggressive | Position trades, high-volatility assets, weekly charts, momentum capture | Maximum trend-riding. Wide stops mean you give back more profit on reversals. | $9.00 below high |
Choosing Your Multiplier
Start with 2x ATR. This is the default in the GOAT Toolkit and the most widely backtested setting across equities, crypto, and forex. It filters out the majority of noise-driven stop hunts while still being responsive enough to catch genuine trend reversals.
Adjust based on your trade data. If you notice your trailing stop getting hit repeatedly in the middle of trends that continue without you, increase to 2.5x or 3x. If you're consistently giving back too much profit before the stop triggers, tighten to 1.5x. Let your trade journal — not your feelings — drive the adjustment.
One critical detail that most ATR guides miss: the ATR lookback period matters as much as the multiplier. The standard 14-period ATR averages roughly two weeks of daily data. For faster-moving strategies (intraday, 2–3 day swings), a 7-period ATR is more responsive. For position trades held for weeks, a 21-period ATR smooths out short-term volatility spikes and gives a more stable trailing distance.
The GOAT Toolkit defaults to a 14-period ATR with a 2x multiplier. These settings are battle-tested across thousands of trades and multiple market regimes. They work because they sit in the statistical sweet spot: wide enough to survive normal market noise, tight enough to exit decisively when the trend actually breaks.
Auto-Invalidation: The GOAT Toolkit Difference
A standard ATR trailing stop tells you where your stop is. That's useful but incomplete. The gap between "knowing where your stop is" and "actually exiting the trade" is where most traders fail. They see the level get hit and think: "Maybe it'll bounce. Maybe this is just a shakeout. Let me wait one more bar." By the time they act, the stop level is three bars in the rearview mirror and the loss has doubled.
The GOAT Toolkit's auto-invalidation eliminates this gap entirely. When price closes below the ATR trailing stop level, the trade is programmatically marked as invalidated on your chart. The visual state changes. The signal label updates. There is no ambiguity, no room for interpretation, no opportunity for your ego to negotiate an extension.
How Auto-Invalidation Works
1. ATR Trail Calculated
The toolkit continuously calculates the ATR trailing stop level based on your chosen multiplier and lookback period. This line is visible on your chart in real-time.
2. Close Monitored
The system monitors bar closes against the trailing level. Intrabar wicks below the level do not trigger invalidation — only confirmed closes. This prevents false signals from volatility spikes.
3. Trade Invalidated
On a confirmed close below the ATR trail, the trade is automatically marked as invalid. The chart signal updates visually. No manual decision needed. No emotional override possible.
The result: your exit system runs on the same objective, volatility-calibrated logic as your entry system. Entry signals are generated by the toolkit's confluence engine. Exit signals are generated by ATR-based invalidation. Both are systematic. Both are non-negotiable. Both are removed from your emotions.
This distinction matters more than most traders realize. The behavioral finance research is clear: the #1 reason traders underperform isn't bad entries — it's bad exits. They hold losers too long (disposition effect) and cut winners too short (fear of reversal). An ATR trailing stop with auto-invalidation attacks both problems simultaneously: it lets winners run as long as the trend holds, and it cuts losers the moment the volatility boundary is breached.
Think of auto-invalidation as the difference between having a fire alarm and having a sprinkler system. The fire alarm (standard trailing stop) tells you there's a problem. The sprinkler system (auto-invalidation) responds to the problem automatically. Both are better than nothing. Only one protects you when you're not paying attention — or when your emotions are screaming at you to do the wrong thing.
Stop Guessing. Start Trailing.
The GOAT Toolkit Builds ATR Trailing Stops Into Every Signal
Every entry signal includes a volatility-adaptive ATR trailing stop with auto-invalidation. No manual calculation. No spreadsheet required. The toolkit handles exit management so you can focus on finding the next trade.
See the Toolkit in Action →Common ATR Trailing Stop Mistakes
ATR trailing stops are powerful, but they're not foolproof. Most traders who implement them still make one or more of these mistakes — usually without realizing it until they've already lost money.
Using ATR From the Wrong Timeframe
If you enter on the daily chart, your ATR trailing stop should use daily ATR. Using a 4-hour ATR on a daily trade gives you a stop that's far too tight because the shorter timeframe produces a smaller volatility reading. The result is constant whipsaws. Your stop timeframe must match your entry timeframe. If you use multi-timeframe analysis to enter, trail on the timeframe where you expect to hold the position.
Overriding the Stop During Drawdowns
Price hits your ATR trailing level. You look at the chart and see support nearby. You think: "I'll just widen it a little. Let it hold this level." You just replaced a systematic, volatility-calibrated exit with a discretionary decision driven by hope. The entire point of the trailing stop is that it removes emotion from the exit. If you override it, you've eliminated the only advantage the system gives you.
Ignoring the ATR Lookback Period
A 14-period ATR and a 7-period ATR on the same chart can produce significantly different values, especially after volatility events like earnings or FOMC. Most traders pick a multiplier and never think about the lookback. But a 2x multiplier on a 7-period ATR during a volatility expansion could be tighter than a 1.5x multiplier on a 14-period ATR during a calm market. Both parameters work together. Optimize them as a pair, not independently.
Using Intrabar Triggers Instead of Closes
Some implementations trigger the stop the moment price dips below the trailing level, even mid-candle. This is a mistake. Intrabar violations happen constantly during normal volatility and are not meaningful. A wick through your stop followed by a close above it is not a trend break — it's just noise. Always require a confirmed bar close below the trailing level. This single rule eliminates a significant percentage of false exits.
Not Adjusting for Asset Type
A 2x ATR multiplier is a good general default, but some asset classes need adjustment. Crypto assets with 24/7 trading and frequent gap moves often need 2.5x–3x to avoid noise exits. Low-float small caps with erratic spreads may need even wider. Forex pairs with tight ranges might work better at 1.5x. Let the asset's behavior — as measured by your backtest results — inform the multiplier choice.
Curve-Fitting the Multiplier to Past Data
You backtest five multiplier values, find that 2.37x produced the best results over the last 2 years, and deploy it. This is overfitting. The "optimal" multiplier in any backtest is an artifact of the specific price path tested. Use round, standard values (1.5x, 2x, 2.5x, 3x) that are robust across different market conditions. A 2x multiplier that works in 8 out of 10 regimes is infinitely more valuable than a 2.37x multiplier that was perfect in one specific 2-year window.
Frequently Asked Questions
What ATR period should I use for trailing stops?
The standard is 14 periods. This captures roughly two weeks of volatility data on daily charts and provides a stable, well-smoothed reading. For faster strategies (scalping, 1–3 day swings), use 7 periods for more responsiveness. For position trades held weeks to months, 21 periods provides a more stable baseline. The GOAT Toolkit defaults to 14-period ATR — this works for the majority of daily-chart swing traders.
Can I use ATR trailing stops on any timeframe?
Yes. ATR trailing stops work on every timeframe from 1-minute intraday charts to monthly position charts. The math scales naturally because ATR measures the average range for whatever timeframe you're on. A 14-period ATR on a 5-minute chart gives you the average 5-minute range. On a weekly chart, it gives you the average weekly range. The multiplier stays the same; the ATR value adjusts to the timeframe automatically. That said, lower timeframes produce more noise and may need slightly wider multipliers (2.5x–3x) to avoid whipsaws.
How is an ATR trailing stop different from a Chandelier Exit?
The Chandelier Exit, developed by Charles Le Beau, is essentially an ATR trailing stop calculated from the highest high rather than the highest close. The core logic is identical: ATR × Multiplier subtracted from a reference price point. The difference is that using the highest high makes the stop slightly wider (since the high is always ≥ the close), which can provide marginally more room during volatile moves. In practice, the performance difference is minimal. The GOAT Toolkit uses the highest close as its reference, which provides a slightly tighter, more responsive trail.
Should I use ATR trailing stops for short trades too?
Absolutely. For short positions, the ATR trailing stop sits above the lowest close since entry: Lowest Close + (ATR × Multiplier). As price falls in your favor, the stop trails downward. The same one-directional ratchet applies — the stop never moves higher. If price closes above the trailing level, the trade is invalidated. The mechanics are symmetrical. One consideration: downside moves often have higher volatility than upside moves (the "volatility smile"). You may want to use a slightly wider multiplier (2.5x instead of 2x) for shorts to account for the sharper counter-trend rallies that occur during bearish trends.
Does ATR work differently in crypto versus stocks?
The math is identical, but the typical values differ significantly. Crypto assets generally have 2–5x higher ATR values relative to price compared to equities, reflecting their higher baseline volatility. This means a 2x multiplier on Bitcoin provides proportionally similar stop-hunt protection as a 2x multiplier on SPY — the ATR automatically adjusts for the volatility difference. However, crypto's 24/7 trading creates more overnight and weekend gaps that stocks don't experience. Some crypto traders prefer a 2.5x or 3x multiplier to absorb these session transitions. The GOAT Toolkit handles crypto and equities with the same engine; the ATR calculation naturally adapts.
Can I combine ATR trailing stops with other exit signals?
Yes, and you should. An ATR trailing stop is a worst-case floor, not the only exit you'll ever take. Many traders combine it with momentum exhaustion signals, exit pressure readings, or profit targets. For example, the GOAT Toolkit uses ATR trailing stops as the baseline exit mechanism, but its exit pressure system can also signal deteriorating momentum before the trailing stop is hit. The ATR trail ensures you always have a defined exit point. The pressure system can get you out earlier when conditions warrant it. The trailing stop is your safety net; other signals are your first line of defense.
Your Exits Are Costing You Money
ATR Trailing Stops + Auto-Invalidation. Built Into Every Signal.
The GOAT Toolkit doesn't just tell you where to enter. It manages every trade from entry to exit with volatility-adaptive ATR stops, auto-invalidation, and exit pressure monitoring. No spreadsheets. No manual calculations. No second-guessing. Every signal comes with a built-in exit system.
Get the GOAT Toolkit →Join traders who exit on data, not emotion.
Further Reading
Why You Hold Losers Too Long (And the Exit System That Fixes It)
The complete exit strategy framework including exit pressure, ATR stops, and trade invalidation. This article's parent guide.
Exit Pressure Explained: Reading Selling Intensity Before the Drop
How exit pressure measures selling intensity independently of your entry thesis. Pairs with ATR trailing stops for a complete exit system.
How to Read Any Chart in 30 Seconds
The foundation: structure, trend, and momentum reading. Understand chart context before placing any stop.
Disclaimer: This content is for educational purposes only and does not constitute financial advice. Trading involves substantial risk of loss. Past performance of any indicator or system does not guarantee future results. Always do your own research and consider consulting a licensed financial advisor before making trading decisions.